Why Customer Journey Data Drives Product Decisions in SaaS

by
Wiktoria Slowikowska
Oct 23, 2024
Identify and convert your most valuable users
Sign Up
Ever sat in a product meeting debating whether to build that new integration or improve your analytics dashboard? Let me share a better way to make these decisions: your product's journey data. Not just basic metrics, but the actual story of how users interact with your SaaS product.
The Problem with Current SaaS Decision Making
Let's be real – most product teams build features based on what they think users want. I've seen teams spend months building fancy dashboards that barely get used, while overlooking simple improvements that could dramatically boost user engagement.
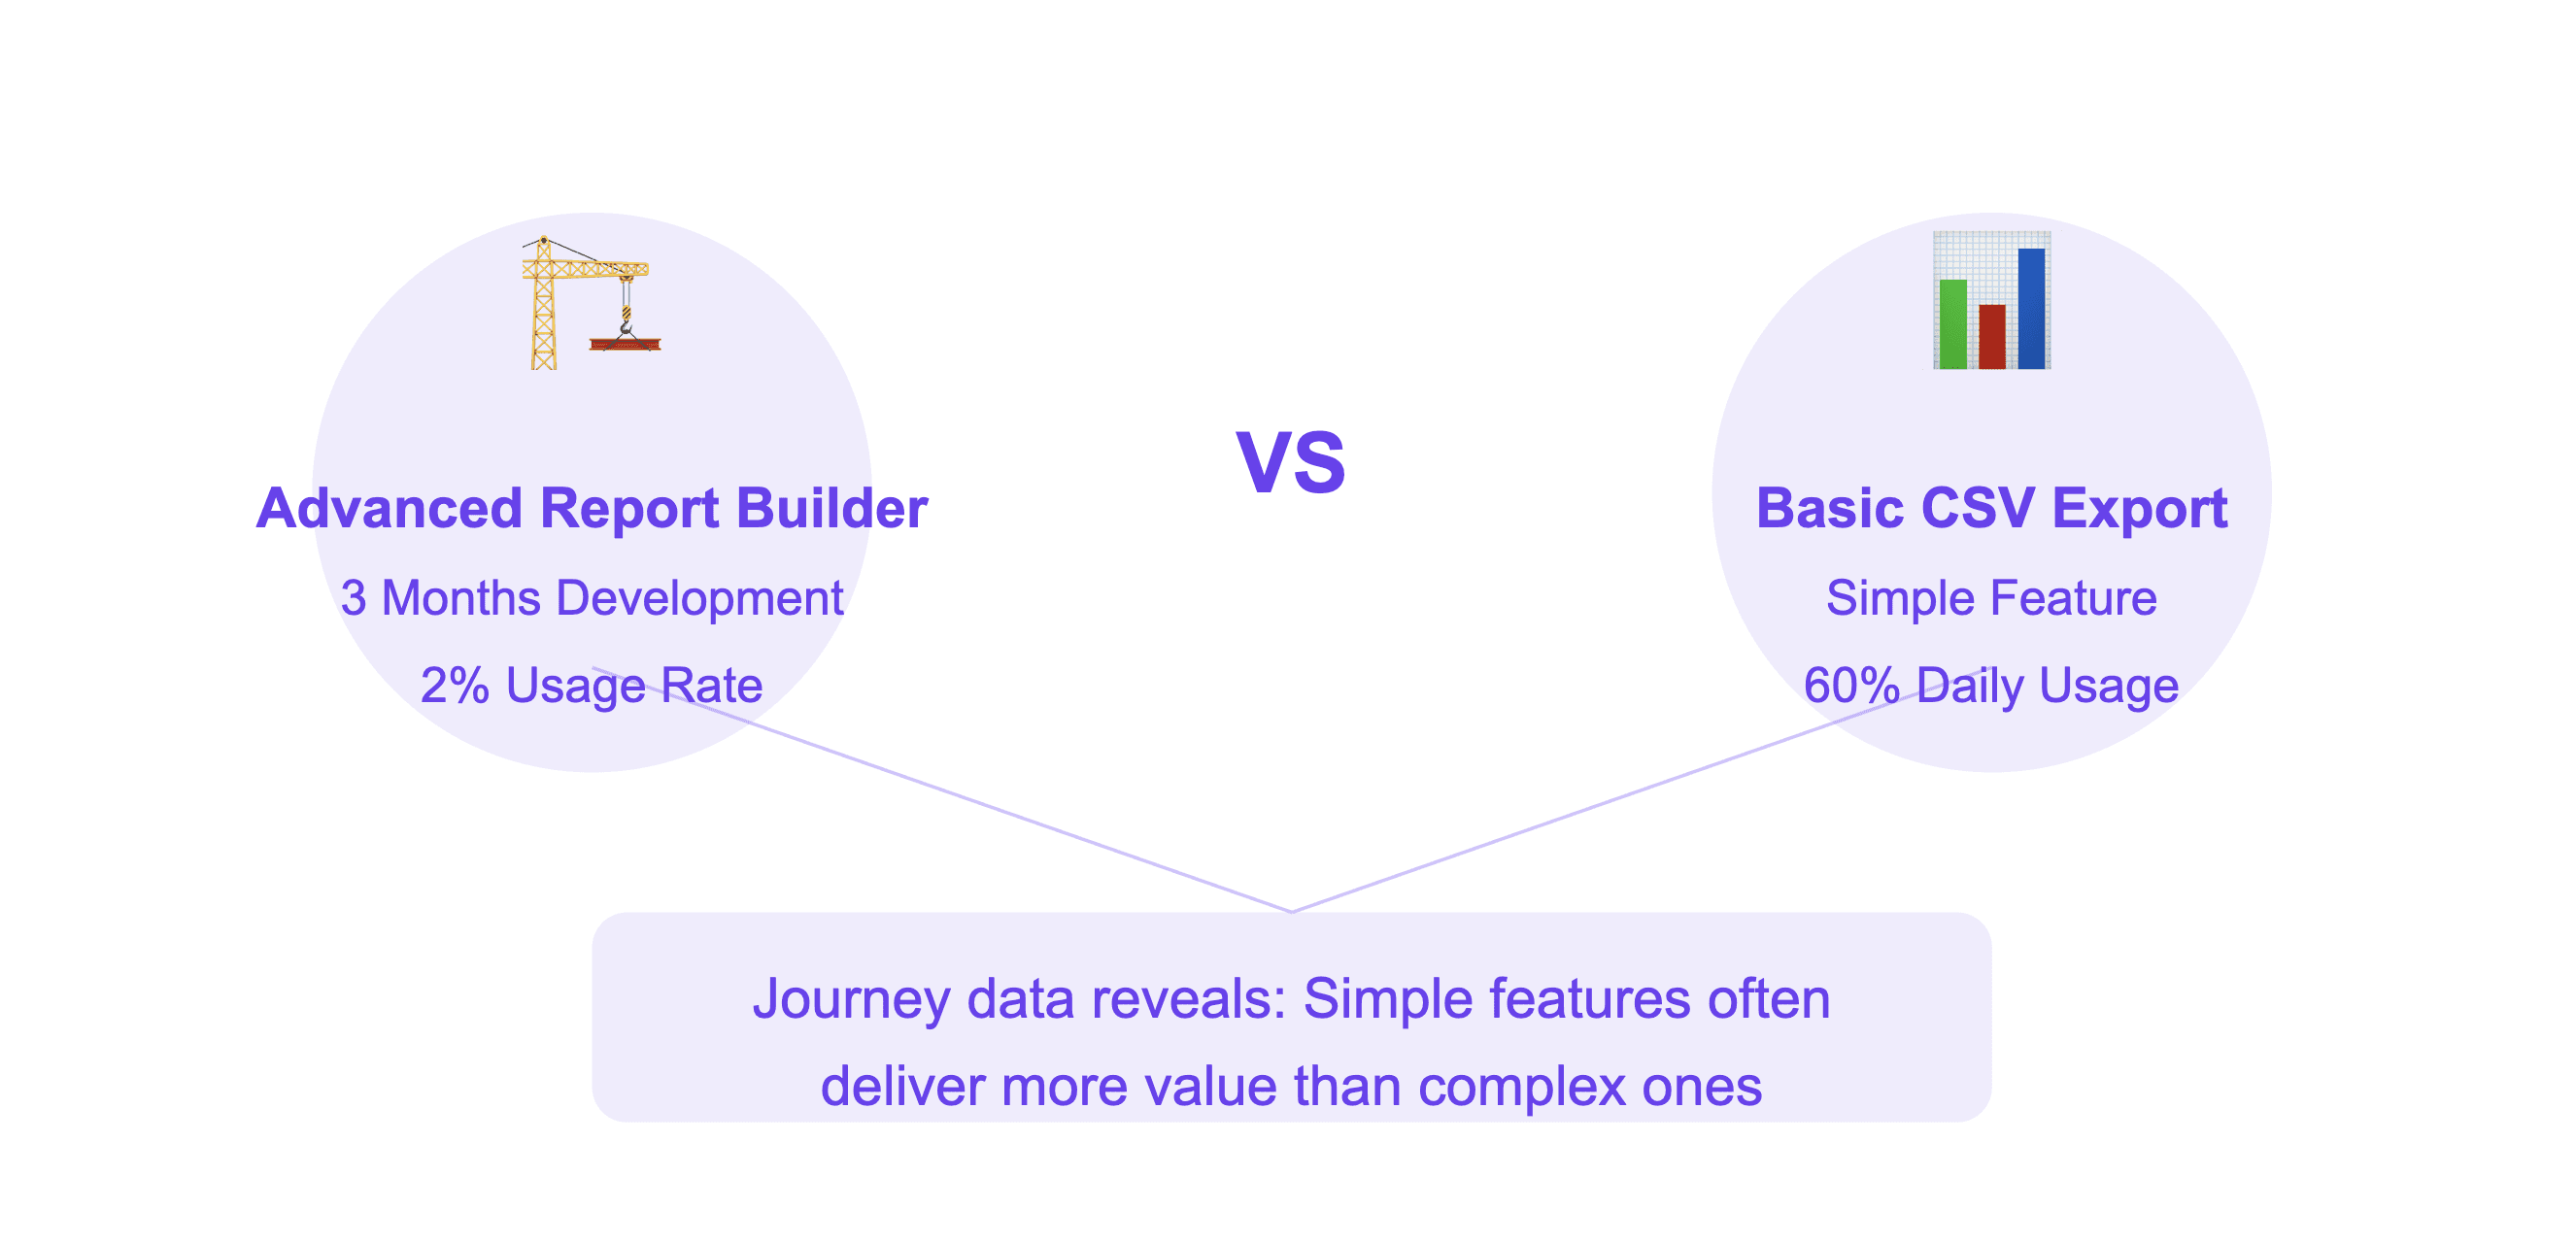
For example, a product team I worked with once spent three months building an advanced report builder because "everyone was asking for it." Guess what? Only 2% of users ever touched it. Meanwhile, their basic CSV export feature was used by 60% of customers daily. That's the kind of insight journey data reveals.

What Journey Data Actually Tells Us
Let's break down the specific data points that really matter for SaaS products.
Time to First Value (TTFV)

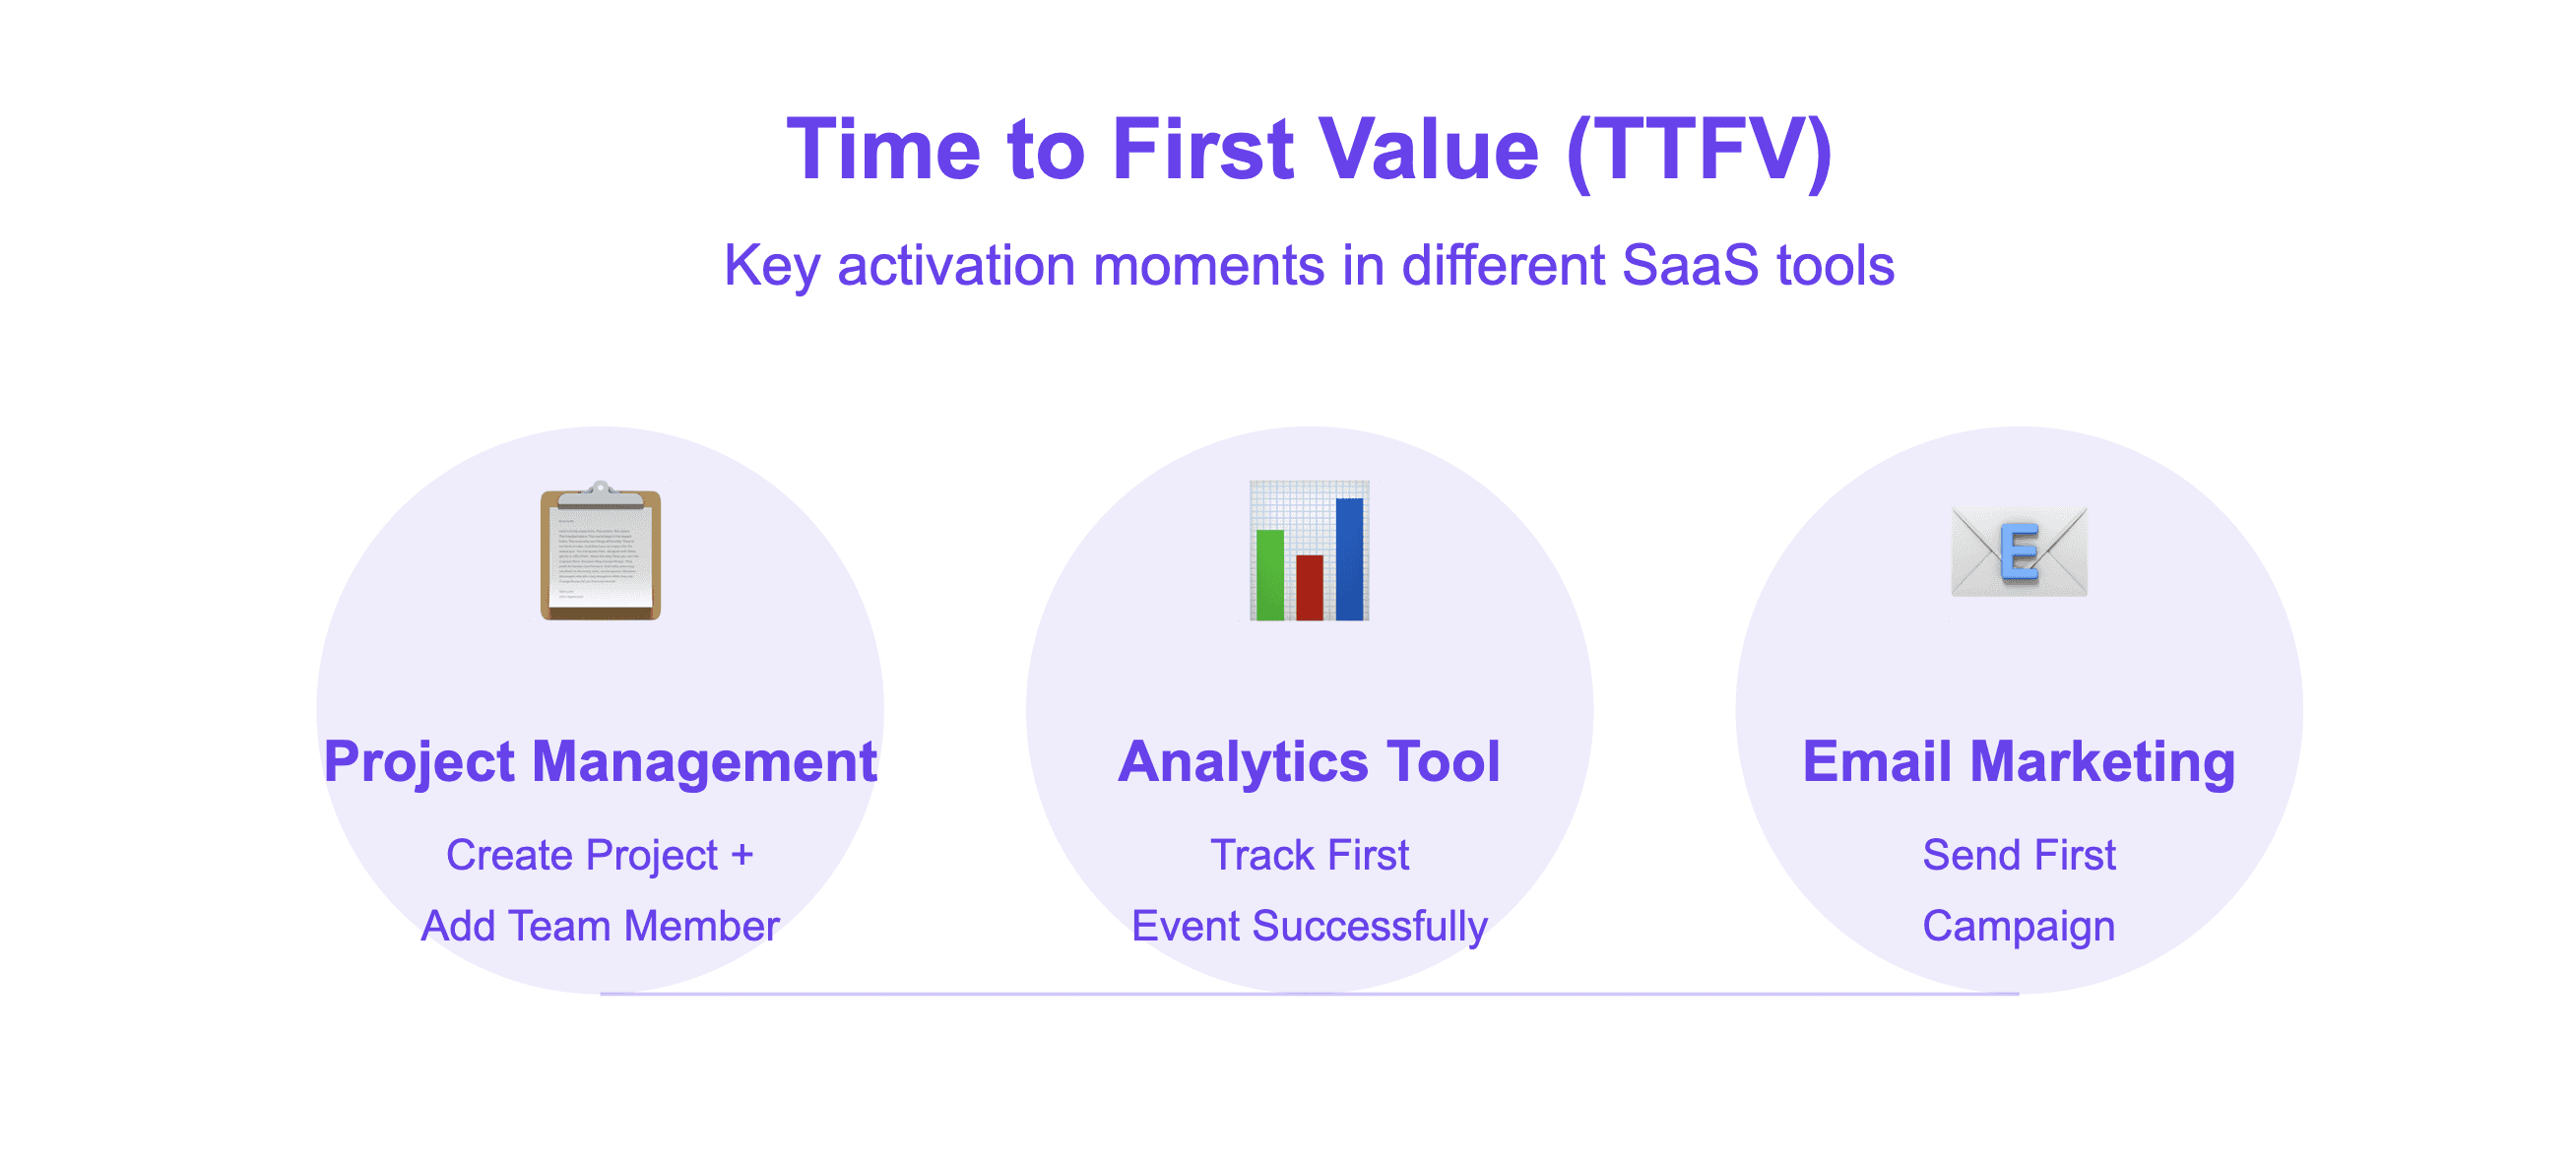
This isn't just about how quickly someone logs in for the first time. It's about tracking specific actions that indicate real value. For instance:
A project management tool's TTFV might be when a user creates their first project and adds a team member
For an analytics tool, it could be when they successfully track their first event
In an email marketing platform, it might be sending their first campaign
Real example: A SaaS company I worked with discovered that users who imported existing data within their first 24 hours were 3x more likely to become long-term customers. This led them to completely redesign their import process and make it a central part of onboarding.
The "Sticky" Feature Patterns
Here's where it gets interesting. Journey data shows us which features actually keep users around. Not just what they say they want, but what they actually use repeatedly.
Let me share a surprising pattern one team discovered: Users who set up more than three automated workflows in their first week were 5x more likely to renew their subscription. But here's the catch – most users didn't even know this feature existed because it was buried in their settings menu.
This insight led to three specific changes:
Moved workflow automation to their main navigation
Added workflow templates for quick setup
Created guided tutorials specifically for automation features
The result? A 40% increase in workflow creation and a 25% boost in renewal rates.
User Success Sequences
Think of this as your product's natural learning curve. We're not talking about random feature usage – we're looking at the specific order in which successful users adopt features.
Here's a real example from a collaboration tool I consulted with:
Week 1: Created first project
Week 2: Invited team members and set up basic workflows
Week 3: Started using templates and custom fields
Week 4: Set up their first automation
Users who followed this pattern had an 80% higher retention rate than those who jumped straight to advanced features or skipped key steps.
How to Actually Use This Data
Let's get practical. Here's how to turn these insights into actual product improvements.
Finding Your Product's "Aha" Moments
Start by looking at your power users. What actions did they take in their first few days that others didn't? For example:
Did they connect certain integrations?
How many team members did they invite?
Which features did they use first?
A data analytics platform I worked with found that users who connected at least two data sources in their first session had a 70% higher activation rate. They redesigned their onboarding to focus entirely on this one action.
Identifying Drop-off Points

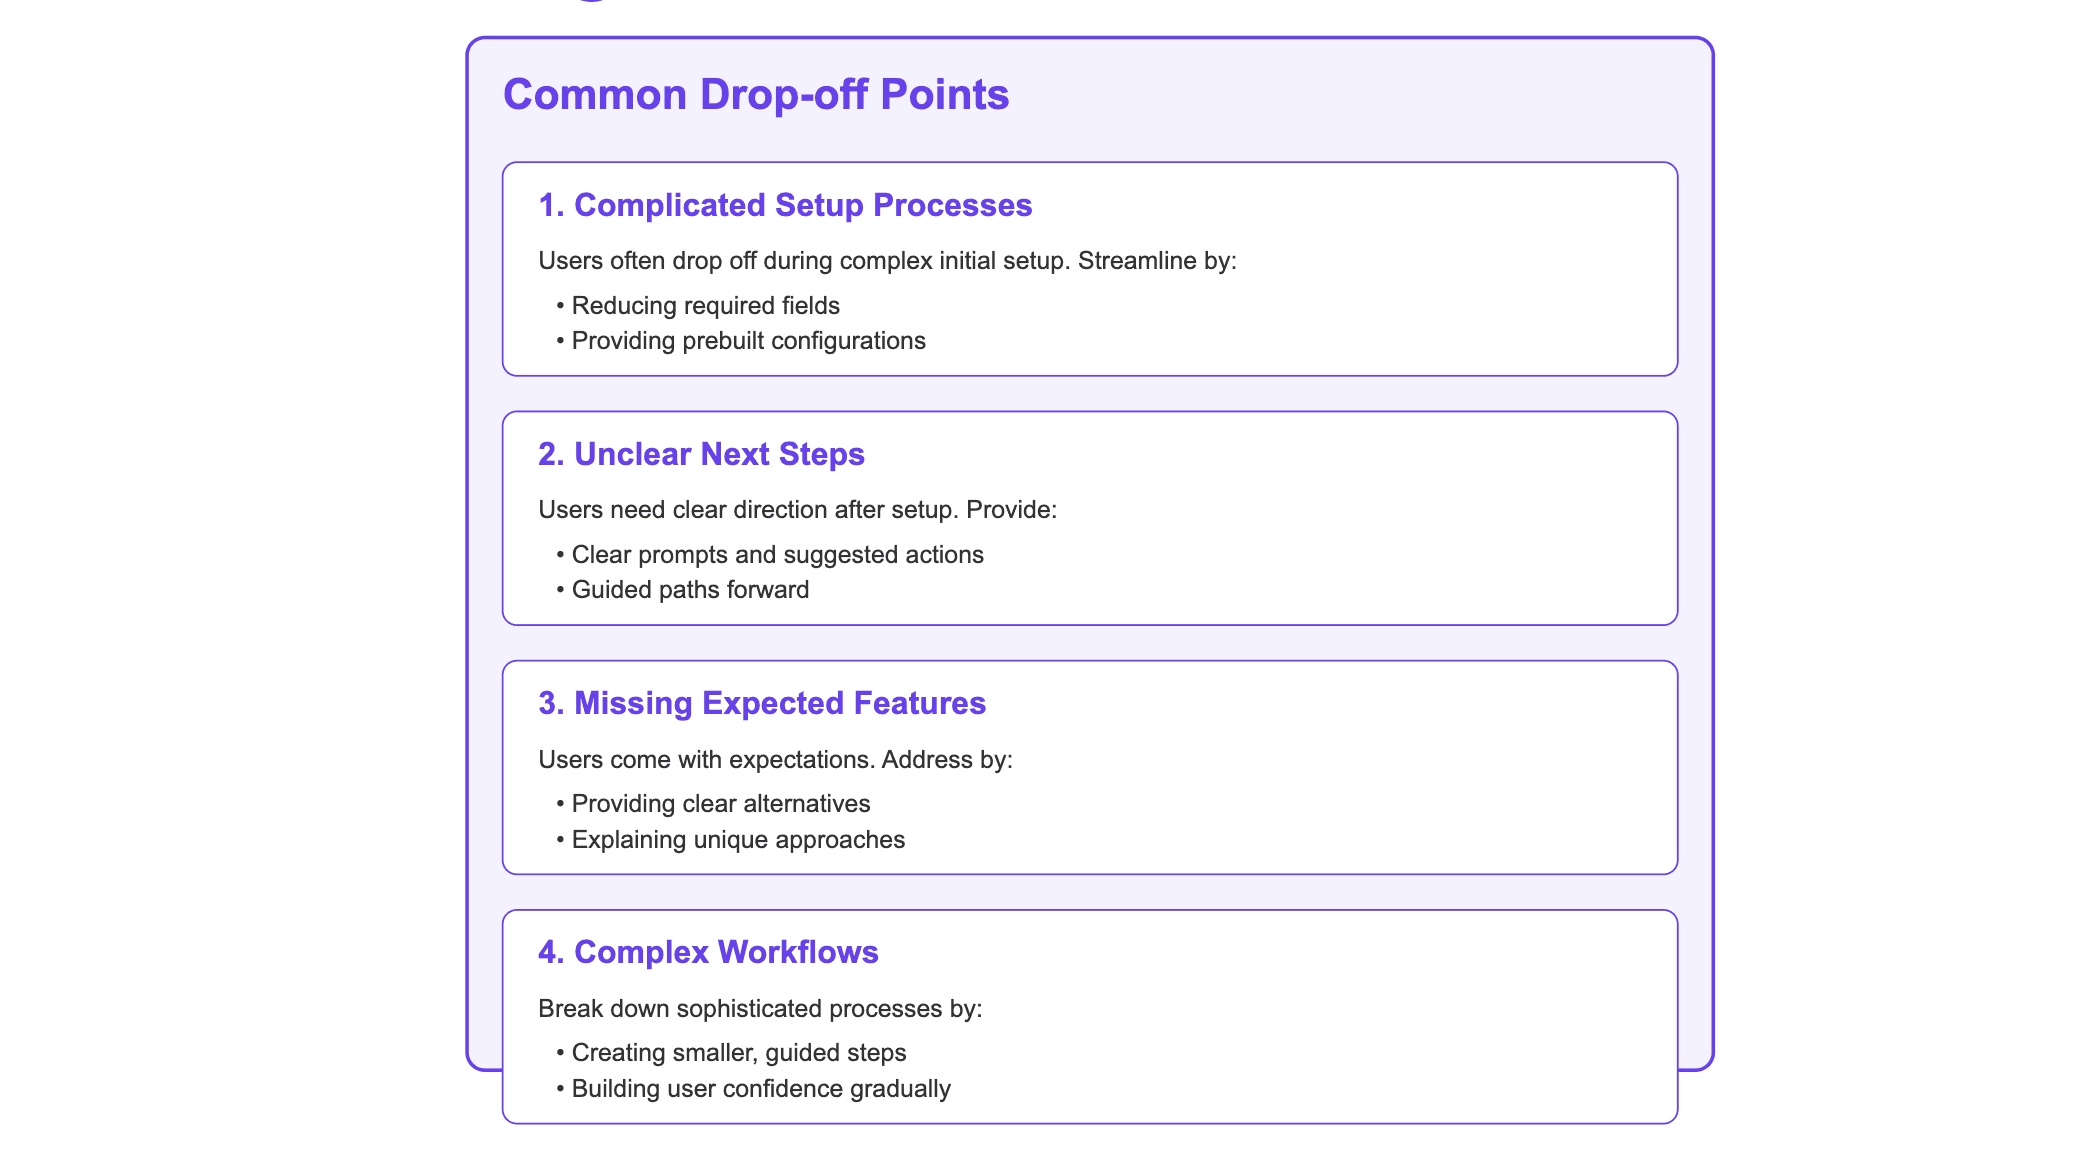
This is where journey data gets really valuable. Look for patterns where users stop engaging. Common patterns include:
1. Complicated Setup Processes
SaaS products often lose users during initial setup when there are too many required steps before seeing value. This could involve multiple integrations, extensive configuration options, or complex data import processes. The most successful products streamline these processes by reducing required fields, providing prebuilt configurations, and automating setup where possible.
2. Unclear Next Steps
After users complete their initial setup, they often need clear direction. Without obvious pathways forward, users can feel lost and unsure about how to proceed. This is particularly common in products with blank slate problems – when users face an empty dashboard or workspace. Clear prompts, suggested actions, and guided paths can help users maintain momentum.
3. Missing Features They Expect
Users often come with expectations shaped by previous experiences or competitor products. When they can't find familiar functionality, they might assume the product lacks capability rather than looking for alternative approaches. This is especially common during the evaluation period when users are comparing solutions. The key is understanding these expectations and either providing clear alternatives or better explaining your product's unique approach.
4. Complex Workflows Without Guidance
Feature-rich products often include sophisticated workflows that can overwhelm users. Without proper guidance, users might avoid these powerful features entirely or give up mid-process. This commonly occurs with advanced features like custom reporting, complex automations, or system configurations. Breaking down complex processes into smaller, guided steps helps users gradually build confidence and capability.
Each of these drop-off points represents an opportunity to improve your product experience. By identifying where users struggle and understanding why, you can create more intuitive paths to value.
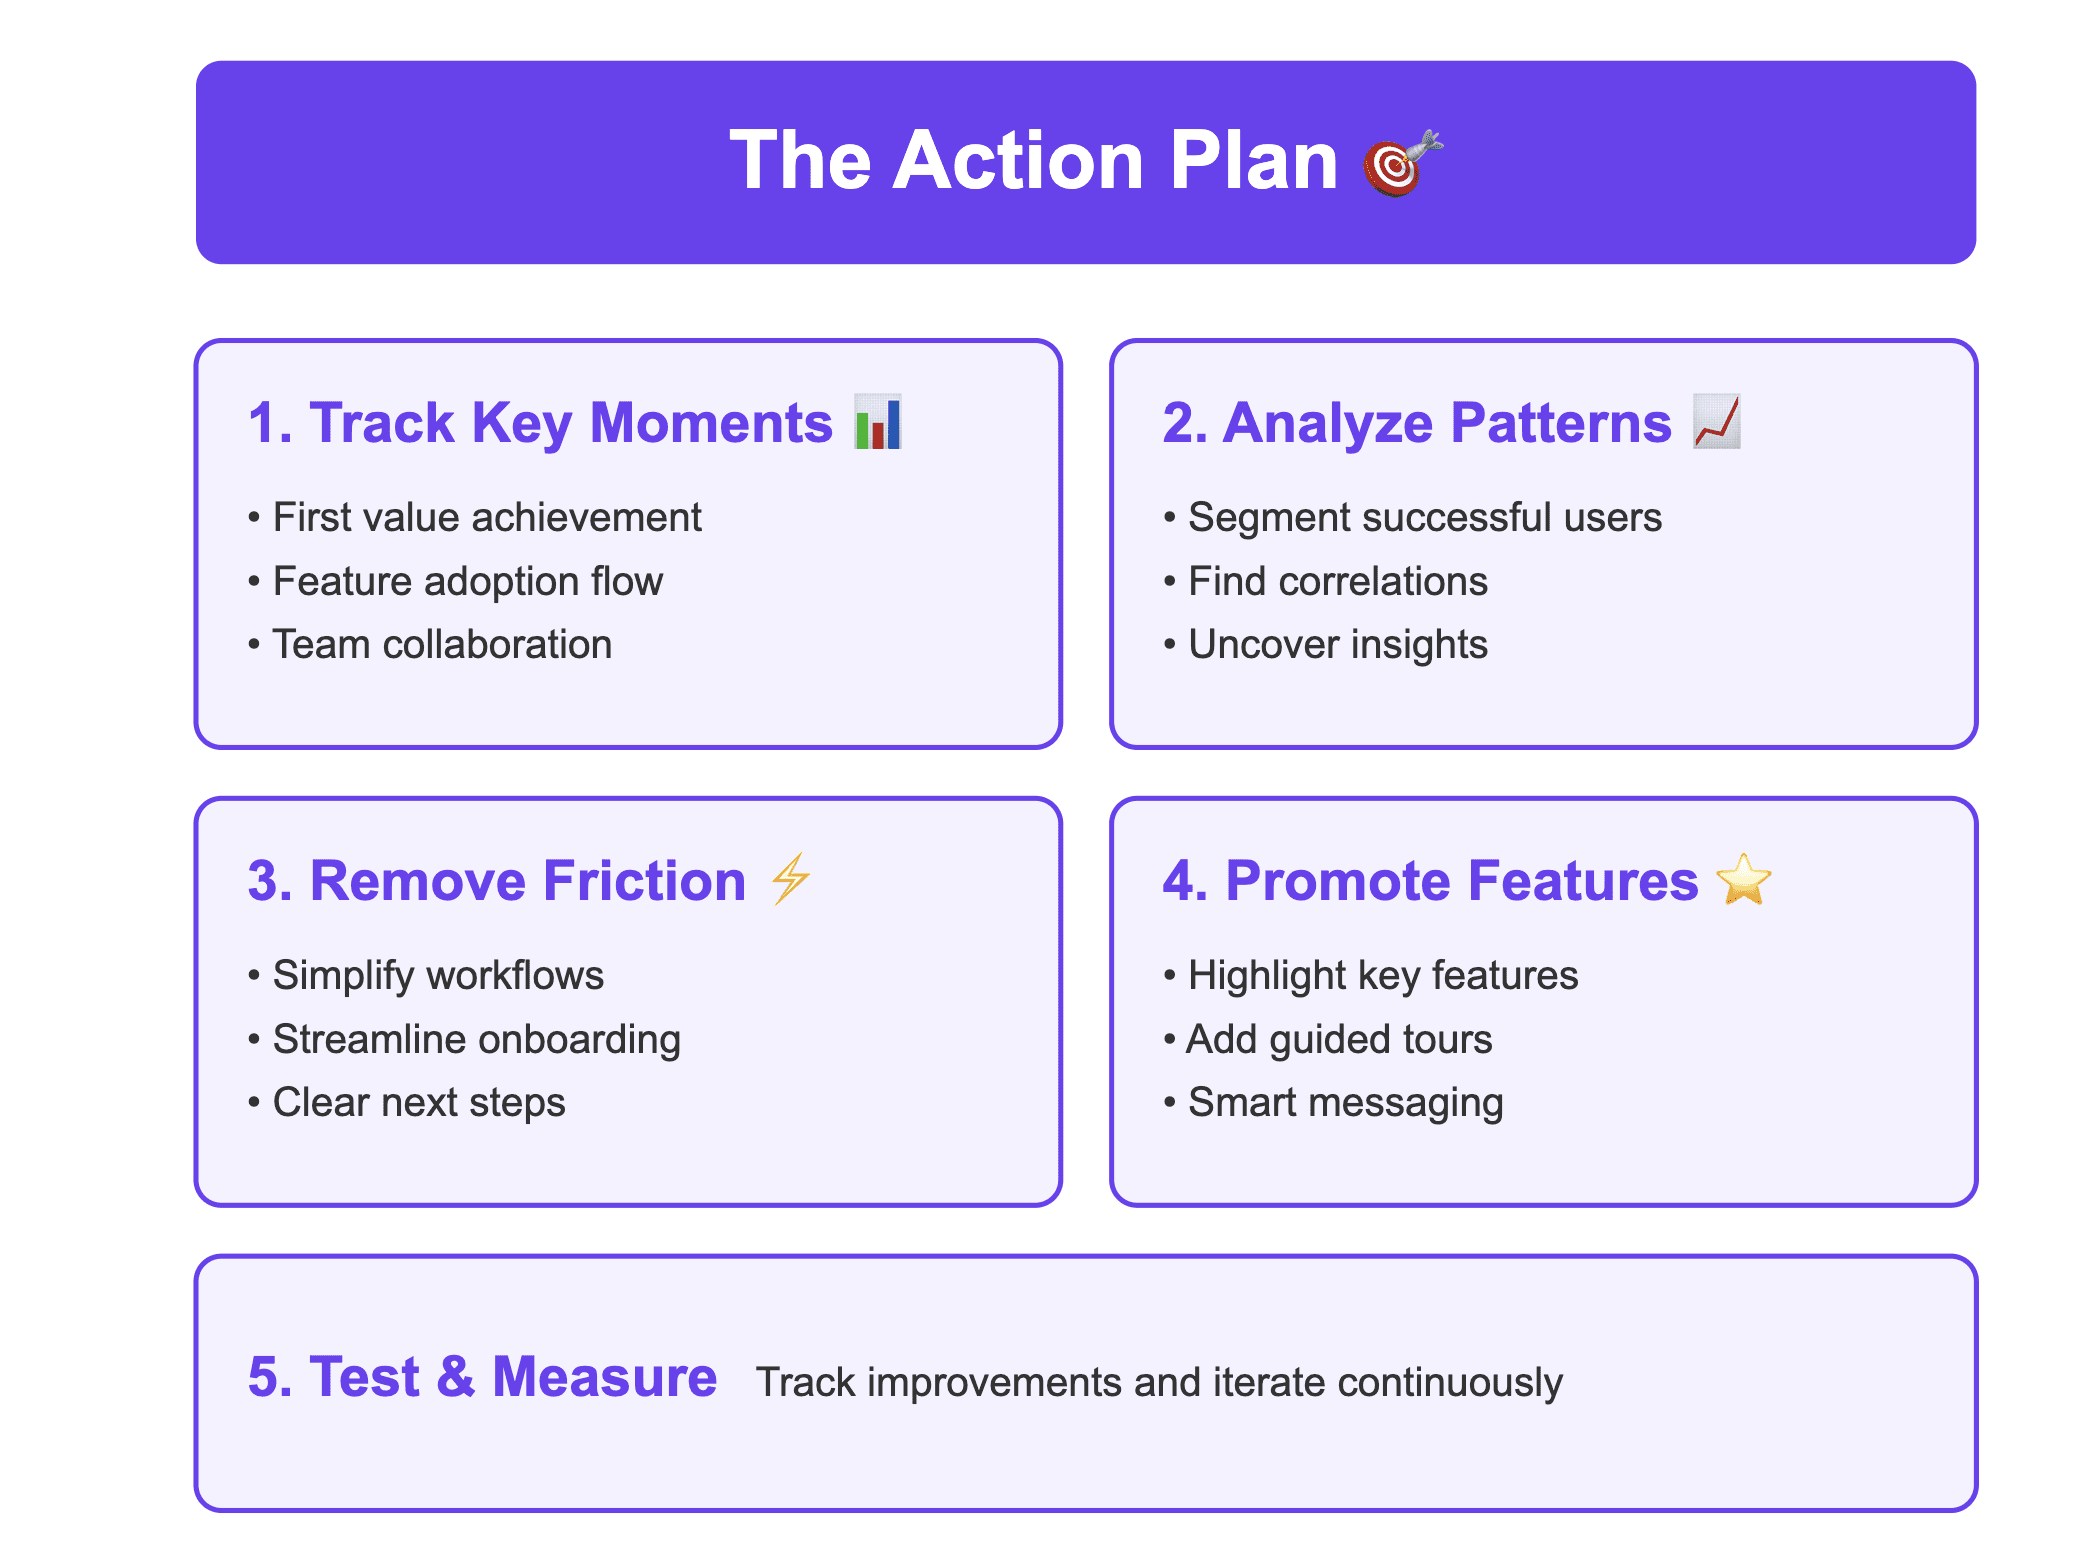
The Action Plan

Having discussed the value of customer journey data and how it drives better product decisions, let's break down how to actually put these insights into action. Gathering data is just the first step, but knowing how to transform that data into tangible improvements for your SaaS product is where the magic happens. Here’s a more detailed action plan to guide you through the process:
1. Track the Right Key Moments
The goal isn’t to track every single user interaction, but rather to focus on critical milestones that align with user success. These "aha moments" are pivotal points where users first realize the value of your product. By identifying and tracking these moments, you can improve user engagement and retention.
Examples of Key Moments to Track:
First Value Achievement: What’s the first action that indicates a user has experienced value? For a project management tool, this could be creating their first project and inviting a team member. For an analytics tool, it could be tracking their first event.
Feature Adoption Sequence: Which features do your most successful users engage with first? Map out the typical order of feature usage to see if there's a specific pattern linked to higher retention rates.
Team Collaboration Points: For collaborative tools, track when users begin adding team members or integrating with other tools. Collaboration can be a key indicator of deeper product engagement.
Integration Setups: Are users connecting third-party tools early in their journey? For instance, users of a CRM might have higher success rates if they integrate their email systems during onboarding.
Customization Actions: Look at how and when users start customizing their experience, such as setting up dashboards or creating automations.
2. Analyze Success Patterns
Once you’ve tracked the right data points, the next step is to find patterns among your most successful users. These patterns will tell you which behaviors and sequences of actions are leading to better outcomes.
Steps to Analyze Patterns:
Segment Users by Success: Break down your users into different cohorts based on specific success metrics like activation, retention, or conversion. Then analyze what actions the most successful cohort took in their journey.
Look for Correlations: Identify correlations between user actions and long-term success. For instance, users who set up integrations within their first week might show higher retention rates. Similarly, users who create more than three custom reports might be more likely to renew their subscriptions.
Discover Hidden Insights: Journey data might reveal hidden opportunities. Perhaps a feature that’s underused has the potential to drive higher engagement when promoted properly.
3. Remove Friction Points
Data isn’t just about finding what works – it’s also about uncovering what doesn’t. Drop-offs in the customer journey reveal where users struggle, get confused, or lose interest. Your goal is to reduce these friction points.
How to Remove Friction:
Simplify Complex Workflows: Look at the actions that cause users to drop off. Are there steps that are unnecessarily complex? Break down advanced features into smaller, more manageable steps and create tutorials or tooltips to guide users through difficult processes.
Streamline Onboarding: Review your onboarding process to ensure it’s as frictionless as possible. Too many steps or too much information upfront can overwhelm new users. For example, if importing data is a critical step, make this process effortless by offering templates or automations.
Provide Clear Next Steps: After a user completes their initial tasks, guide them toward their next goal. For products with blank-slate problems (e.g., an empty dashboard), provide prompts or pre-populated examples to show users how to continue.
4. Promote High-Impact Features
Your journey data may reveal features that are underutilized but crucial for long-term success. Promote these features through targeted onboarding, tutorials, or in-product messaging.
How to Highlight Key Features:
Move Key Features to Prominent Locations: If a key feature is buried in a settings menu, it may not get the visibility it deserves. Consider surfacing it in the main navigation or in a prominent location within the user interface.
Use Contextual Product Tours: Walk users through the steps of setting up these high-impact features. A well-placed tutorial or guided experience can make a big difference in feature adoption.
Leverage In-App Messaging: Send personalized messages or tooltips encouraging users to try important features they might not have discovered yet. These nudges should be well-timed, based on their current usage.
5. Test and Measure Continuously
Improving your product isn’t a one-time project – it’s an ongoing process. Once you make changes based on your journey data, measure their impact and iterate accordingly.
Moving Forward
Here's your action plan to start using journey data effectively:
Define Success Metrics: Start with clear definitions of what success looks like for your users. Is it sending their first email campaign? Creating their first automation? Be specific.
Map Current Patterns: Look at your current users' journeys. Where are they succeeding? Where are they getting stuck?
Test and Measure: Make small changes based on your data and measure the impact. Don't try to fix everything at once.
The Bottom Line
Journey data isn't just about collecting numbers – it's about understanding the story of how your users succeed (or don't) with your product. When you understand these patterns, you can make product decisions that actually impact your bottom line.
Remember: The best product decisions aren't based on opinions or market trends – they're based on actual user behavior. Start listening to what your journey data is telling you, and let it guide your product development.
Need help getting started? Begin by identifying your product's key success metrics and tracking how your best customers achieved them. The patterns you discover will light the way forward.


