
Using Google Analytics to Drive Product Activation in SaaS

by
Wiktoria Slowikowska
Nov 14, 2024
Identify and convert your most valuable users
Sign Up
Achieving product activation is a crucial milestone in the user journey. Activation is the stage where users experience the value of your product for the first time, prompting them to move toward long-term engagement and conversion. One powerful tool to help optimize this process is Google Analytics (GA). By leveraging GA effectively, you can gain deep insights into user behavior, identify friction points, and make data-driven decisions to enhance the activation experience.
This article will cover practical strategies for using Google Analytics to monitor, analyze, and boost product activation in your SaaS business.
1. Set Up Google Analytics with Your SaaS Product
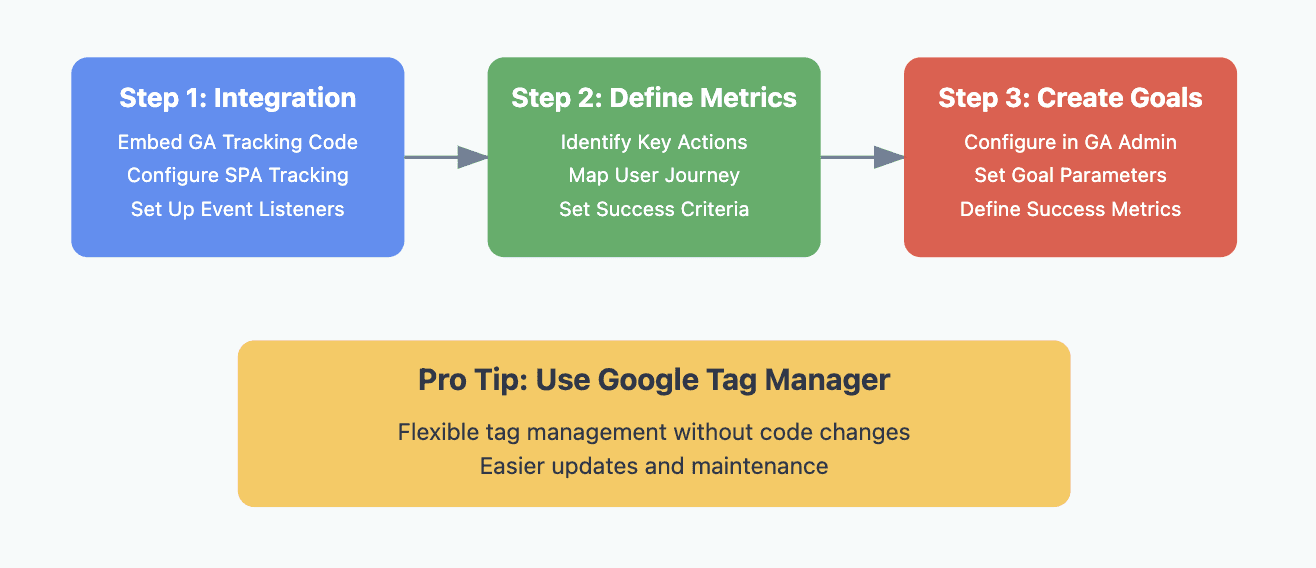
Before diving into data analysis, ensure that GA is properly set up for your SaaS platform. This involves linking GA to your product, defining clear tracking parameters, and setting up goals that align with activation milestones.
Steps to Set Up GA for Product Activation:
Integrate GA with Your Product: Embed the GA tracking code into your SaaS platform. If you’re using a single-page application (SPA), ensure that tracking covers page views and custom events.
Define Key Activation Metrics: Identify the specific actions that signify product activation. This could be completing onboarding, using a core feature, or achieving a specific outcome like sending an email campaign or generating a report.
Set Up Conversion Goals: In GA, go to Admin > Goals to create goals that align with these activation events. For example, set up a goal for “Completed Onboarding” or “First Feature Use.”
Pro Tip: Use Google Tag Manager for a more flexible way to manage and update tracking tags without altering your site code.
2. Track Key User Behaviors for Activation
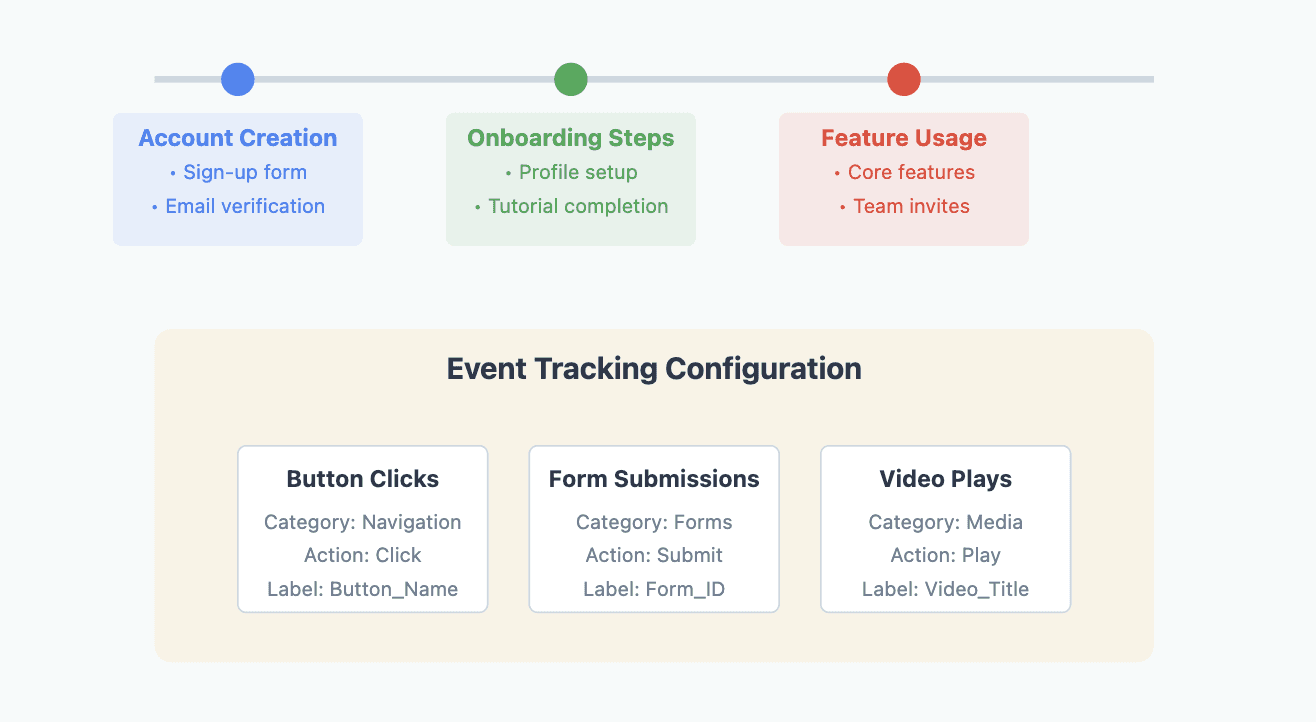
Activation isn’t a single action; it’s a series of steps that guide users to their “aha” moment. To understand this journey, you need to track specific user behaviors.
Important User Actions to Track:
Account Creation and Sign-Up Completion: This is the entry point. Monitor where users drop off during the sign-up process and what actions they take right after signing up.
Onboarding Steps: Break down onboarding into measurable actions, such as filling out a profile, setting preferences, or engaging with a tutorial.
Feature Utilization: Identify which features correlate with higher retention. If your SaaS is a project management tool, this might mean creating their first project or inviting team members.
Setting Up Event Tracking: Use GA’s Event Tracking to track these key interactions. Events can be configured to capture:
Button Clicks: Track if users click “Start Tutorial” or “Explore Dashboard.”
Form Submissions: Measure how many users submit forms as part of onboarding.
Video Plays: See if users watch tutorial videos and for how long.
Pro Tip: Define events with clear categories, actions, and labels to make analyzing them easier.
3. Analyze User Flows to Identify Bottlenecks
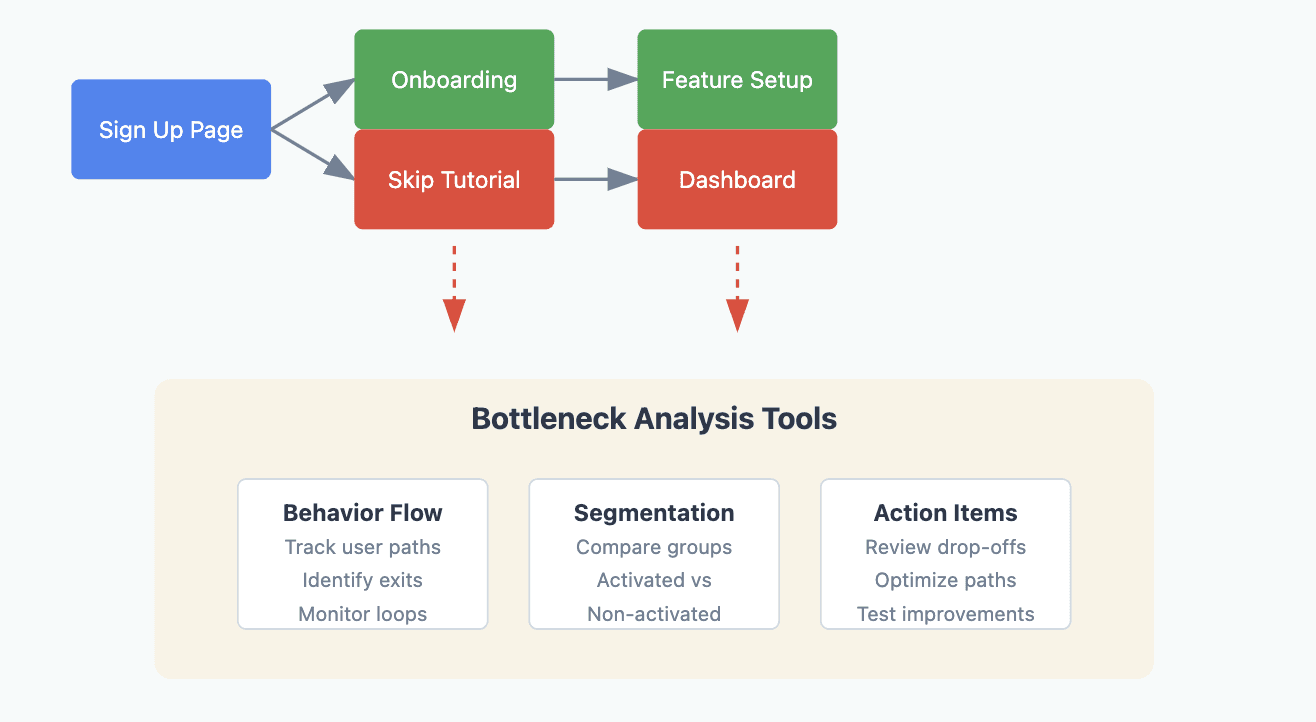
GA’s Behavior Flow and User Flow reports help visualize how users navigate through your SaaS product. These tools can show where users drop off, backtrack, or pause, revealing potential barriers to activation.
How to Use Flow Reports:
Identify Drop-Off Points: Use the Behavior Flow report to find out where users abandon the onboarding process or stop using features. For instance, if many users drop off after viewing a particular step in onboarding, that’s a signal to review and improve that step.
Path Analysis: See common paths users take from sign-up to first key interactions. This helps pinpoint whether users are following the expected journey or diverging.
Actionable Steps:
Go to Behavior > Behavior Flow to explore navigation paths.
Filter by new users to focus on those experiencing the product for the first time.
Look for areas where users loop back or consistently exit.
Pro Tip: Use segmentation to compare user flows of activated versus non-activated users to understand what differentiates them.
4. Create Custom Dashboards for Activation Insights
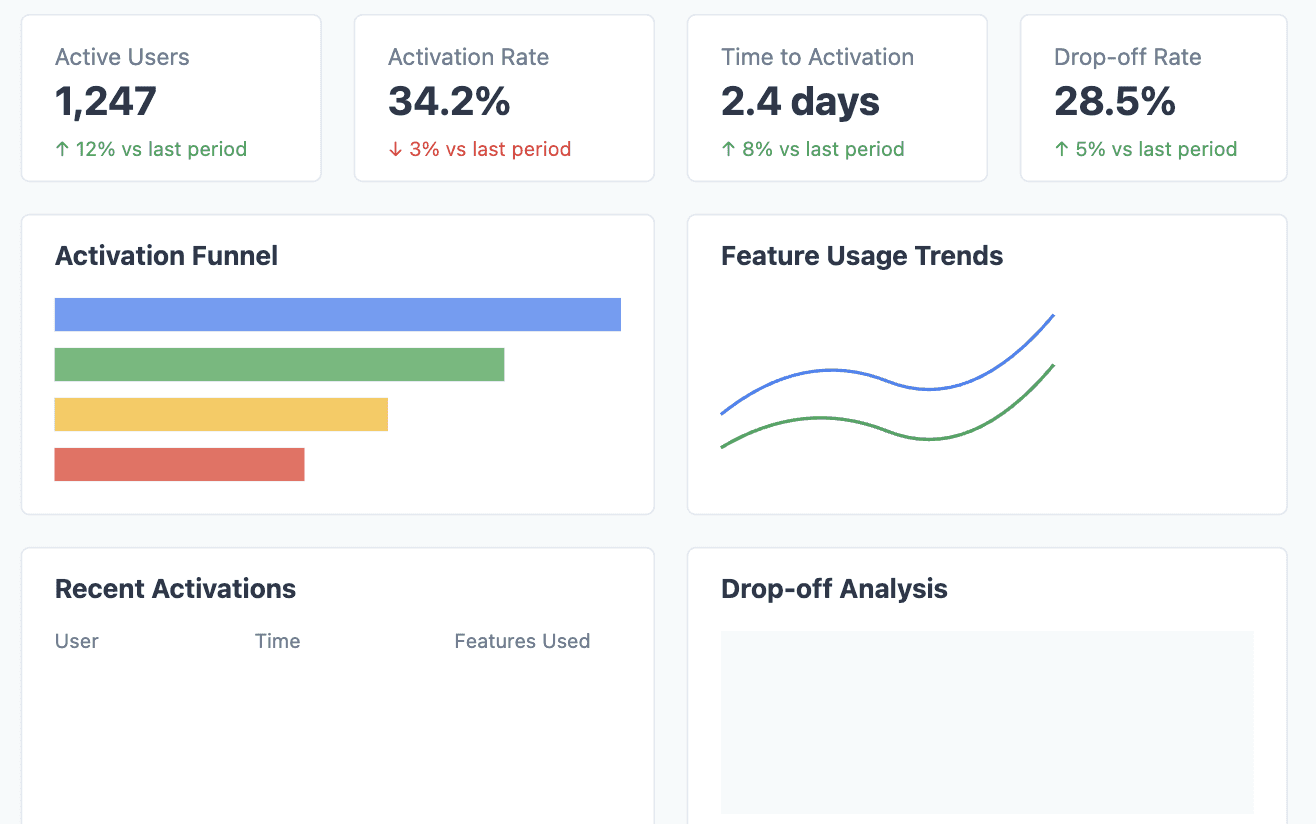
GA allows you to create custom dashboards that consolidate essential data in one place. Building a dedicated “Activation Dashboard” can help you monitor key metrics without navigating through multiple reports.
Components of an Effective Activation Dashboard:
User Engagement Metrics: Include data on session duration, page views, and interactions with key features.
Goal Completions: Display the number of users achieving defined activation goals, such as completing onboarding or using a core feature.
Drop-Off Rates: Highlight where user drop-offs occur during the activation process.
How to Set Up a Dashboard:
Go to Customization > Dashboards in GA.
Create a new dashboard and select widgets that display data like event completions, page views, and behavior flow metrics.
Set up real-time data widgets to monitor how current users are interacting with activation features.
Pro Tip: Share this dashboard with your team for easy access to activation performance data.
5. Use Cohort Analysis to Understand Activation Over Time
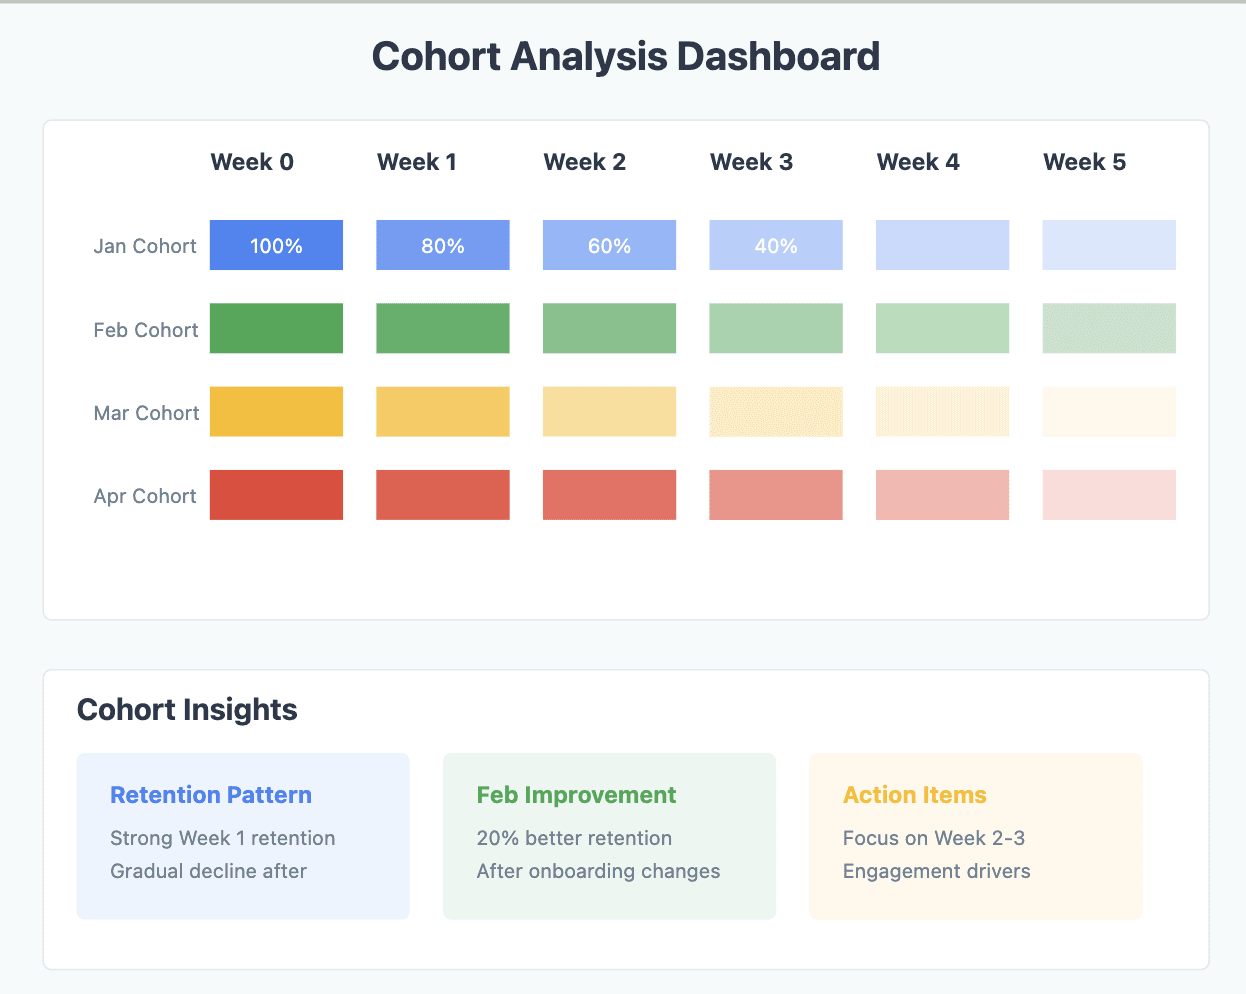
Cohort Analysis is an underutilized but powerful tool in GA that can show how different groups of users behave over time. This is particularly useful for understanding activation rates and retention.
Why Use Cohort Analysis?
Track Long-Term Behavior: See if users who activate in the first week maintain their engagement in subsequent weeks.
Optimize Onboarding Tweaks: If you make changes to onboarding, cohort analysis helps measure the impact on user behavior over time.
How to Use Cohort Analysis:
Go to Audience > Cohort Analysis.
Select the metric (e.g., user retention) and the date range that matches your onboarding process.
Analyze whether changes in the product or onboarding sequence have affected activation rates.
Pro Tip: Combine cohort data with surveys to gather qualitative feedback on why users in certain cohorts converted or churned.
6. Leverage Funnel Visualization Reports
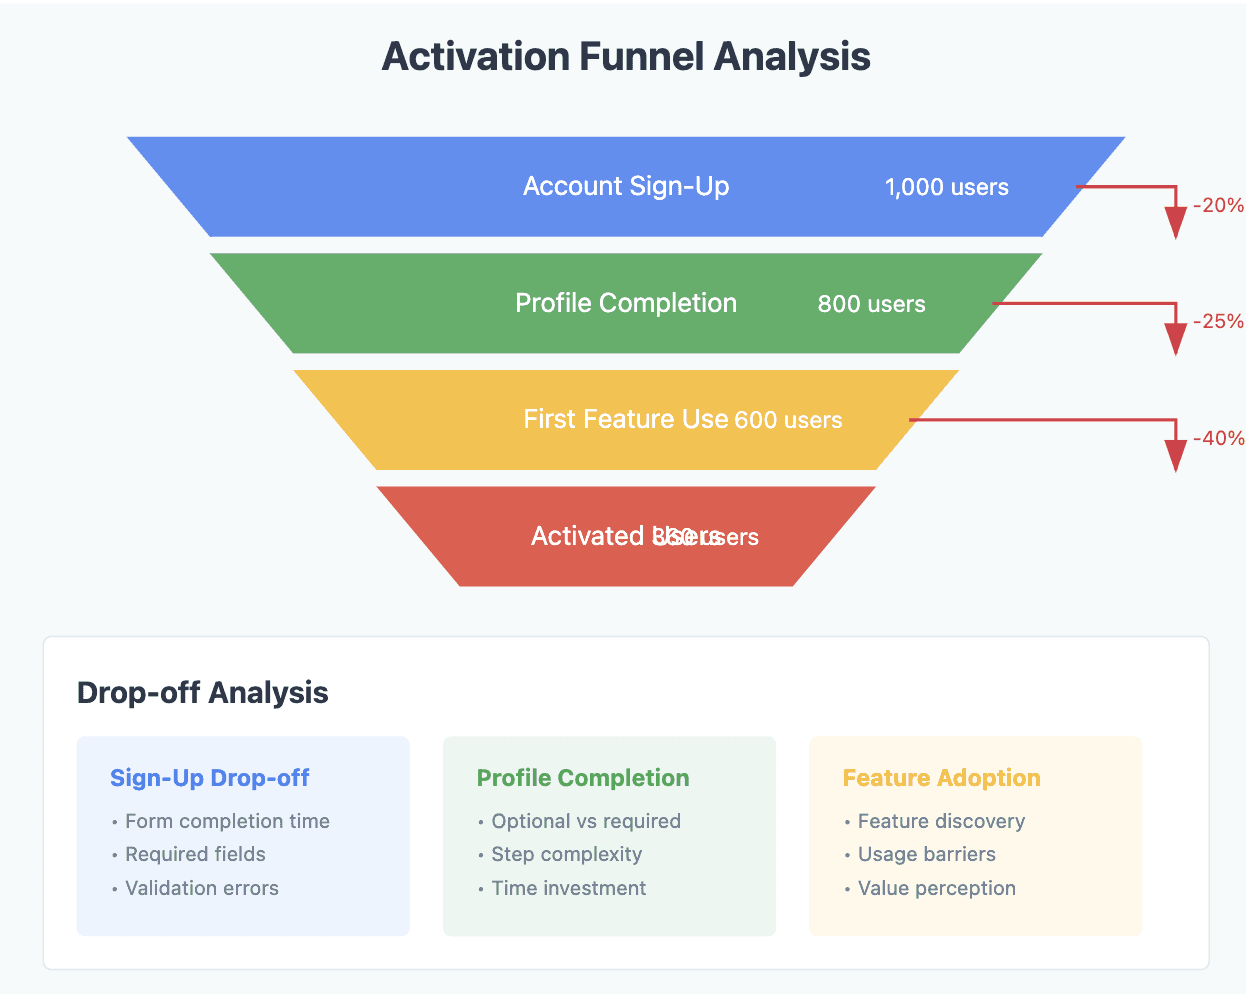
A more focused approach for tracking step-by-step activation processes is through GA’s Funnel Visualization report. This tool helps you see how users progress through a defined sequence and where they drop off.
How to Set Up Funnel Visualization:
Define each step in the funnel that leads to activation. This might include:
Account Sign-Up
Profile Completion
First Feature Use
Analyze drop-offs at each stage to see where users are not converting.
Benefits:
Pinpoint Sticking Points: If most users drop off at step 2 (e.g., profile completion), it’s a strong indicator to simplify or improve that step.
Iterative Improvements: Use the funnel to test small adjustments and monitor their impact.
Pro Tip: Combine funnel insights with heatmaps to understand if design elements are causing user confusion.
7. Conduct A/B Testing to Validate Changes
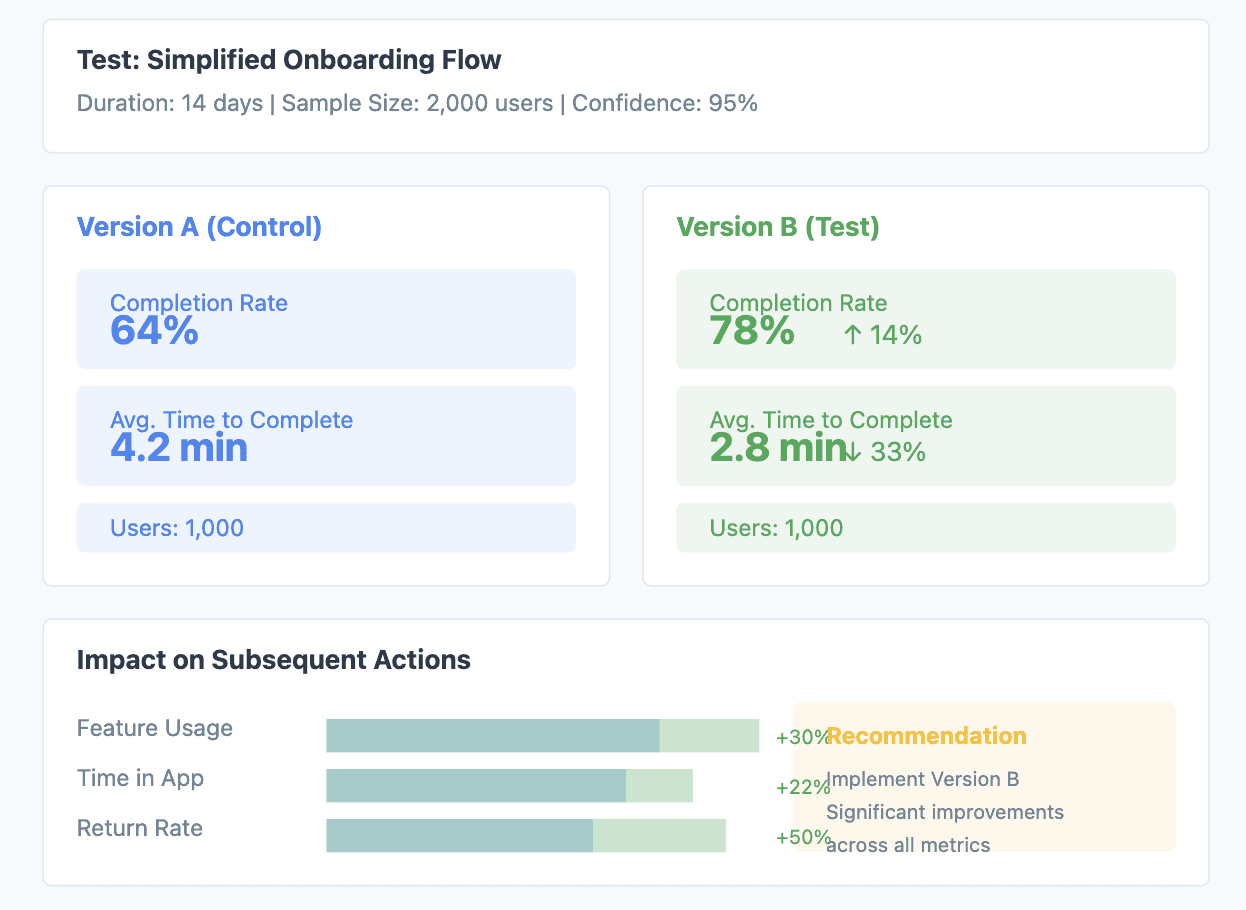
Data from GA should guide your optimization efforts, but it’s essential to test changes before rolling them out broadly. A/B testing lets you compare the effectiveness of different variations.
How to Run A/B Tests Using GA Data:
Identify a key step in the activation process that needs improvement (e.g., onboarding).
Create a variation that simplifies or alters that step.
Use tools like Google Optimize in conjunction with GA to run and measure your A/B tests.
Metrics to Monitor During A/B Tests:
Completion Rates: Did more users complete onboarding or another key activation step?
Engagement Time: Did users spend more time interacting with core features after changes?
Subsequent Actions: Did users progress further into the activation funnel?
Pro Tip: Avoid testing multiple major changes at once. Focus on one variable to keep results clear and actionable.
8. Optimize Based on User Segmentation
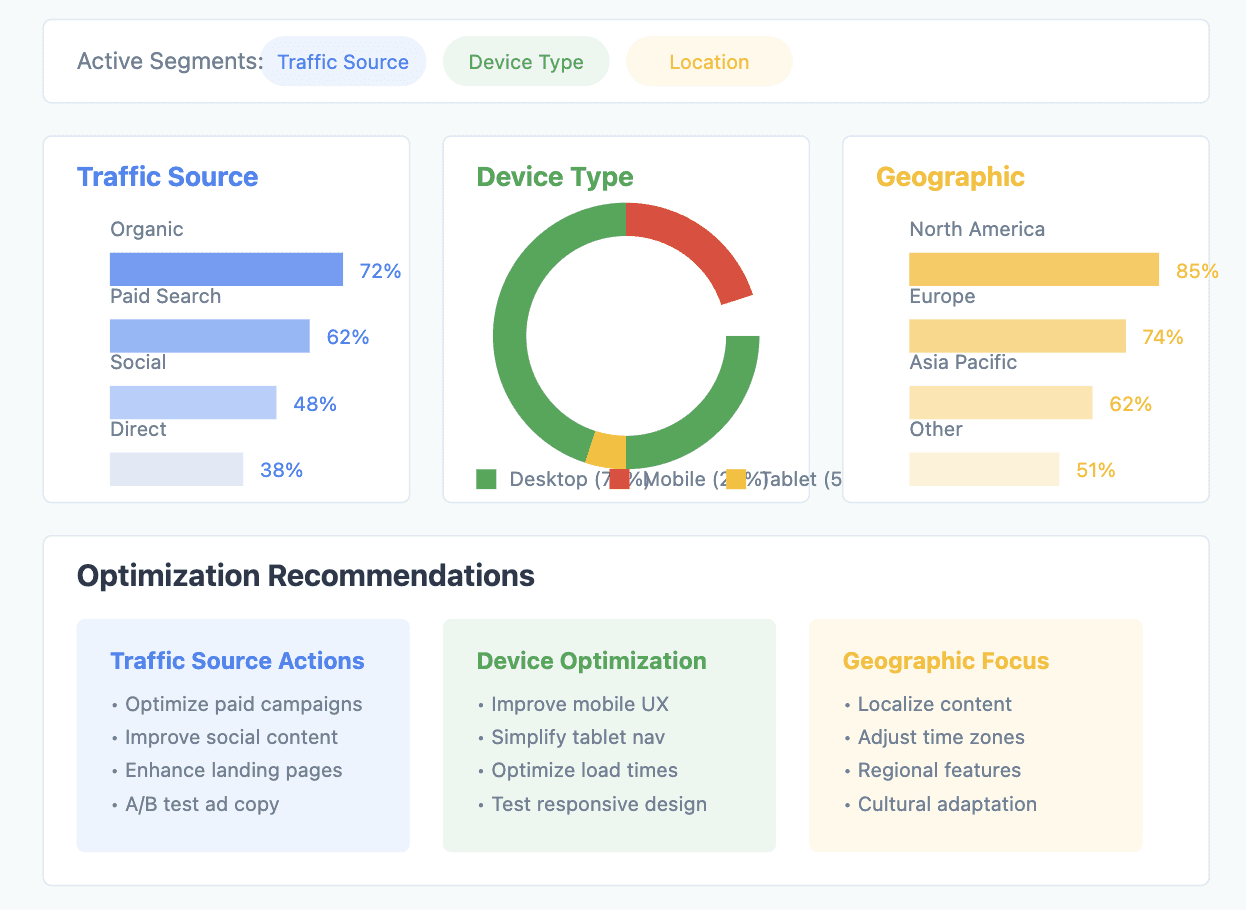
Different users may have unique needs or preferences, which means their paths to activation can vary. GA’s segmentation features let you analyze behavior across different user groups.
Segment Your Users By:
Traffic Source: Understand if users from ads or organic search are more likely to activate.
Device Type: Check if mobile users face more activation challenges compared to desktop users.
Geographic Location: See if users from different regions activate at different rates, potentially due to language or cultural barriers.
Benefits:
Tailored Solutions: If mobile users are less likely to activate, consider making your mobile onboarding smoother.
Localized Adjustments: Improve translations or region-specific content if certain locations underperform.
Pro Tip: Create custom segments and monitor them over time to see if tailored adjustments improve their activation rates.
Final Thoughts: Continuous Improvement with Data
Driving product activation in a SaaS environment requires a mix of strategic tracking, analysis, and iterative changes. Google Analytics is a powerful ally in this process, offering insights that can refine user journeys, streamline onboarding, and increase conversion rates.
Remember, the key is not just to collect data but to act on it. Regularly review your metrics, conduct A/B tests, and optimize based on real user behavior. With consistent effort and smart data application, your product activation rates—and ultimately your bottom line—will grow.


