
Understanding Cohort Analysis in SaaS: A Key to Growth

by
Aleksa Mitrović
Sep 17, 2024
Identify and convert your most valuable users

Sign Up
What is cohort analysis?
Cohort analysis is essential in the SaaS industry, particularly with Product-Led Growth (PLG) where a company has low customer touch points. It involves segmenting users into groups, or cohorts, based on shared characteristics or behaviors within a specific timeframe. This allows companies to track and analyze how these groups interact with the product over time.
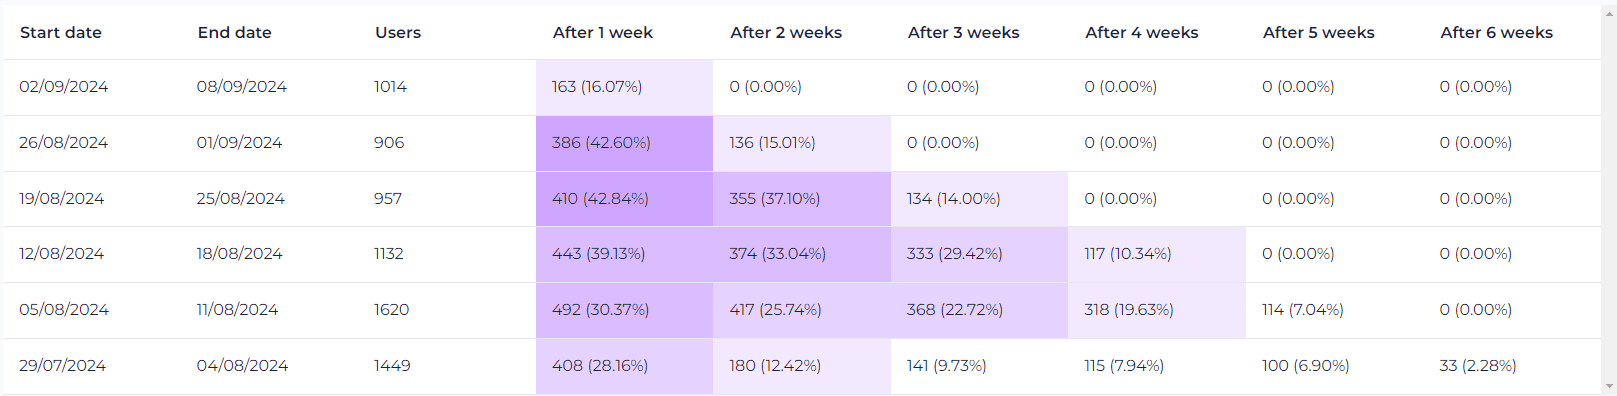
Typical cohort analysis (in this case retention analysis), looks like this:
Key Benefits of Cohort Analysis in PLG SaaS:
Optimizing Marketing Strategies: By analyzing cohorts based on acquisition channels, companies can determine which marketing efforts are most effective in attracting and retaining users
Reducing Churn: Cohort analysis can reveal why users are leaving the product. By identifying cohorts with high churn rates, companies can investigate the underlying causes and take targeted actions to improve retention
Understanding User Behavior: By examining how different cohorts engage with the product, companies can identify patterns and trends in user behavior. This helps in understanding what features or actions drive engagement and retention
Improving Product Development: Insights from cohort analysis can guide product development by highlighting which features are most valued by users. This ensures that the product evolves in a way that meets user needs and preferences
Types of Cohort Analysis:
Acquisition Cohorts: Groups users based on when they signed up for the product. This helps in understanding how the time of acquisition affects user behavior and retention
Behavioral Cohorts: These groups are based on user actions or behaviors. For instance, you might look at users who completed a specific action, like making a purchase or using a particular feature. This type of analysis helps in identifying patterns in user behavior that can inform product improvements and marketing strategies
How to do customer cohort analysis?
Conducting a customer cohort analysis involves several steps to help you understand user behavior and improve retention. Here’s a step-by-step guide:
Define Your Objective: Determine what you want to learn from the cohort analysis. Common objectives include understanding user retention, and user journey, identifying churn points, feature retention, or evaluating the impact of a new feature
Collect Data: Gather the necessary data from your database or analytics tools. This data should include user information such as sign-up dates, activity logs, tracked events, and any other relevant metrics
Segment Users into Cohorts: Group users based on a common characteristic. The most common method is to create acquisition cohorts based on the date users signed up. You can also create behavioral cohorts based on specific actions users have taken
Analyze Cohort Behavior: Track the behavior of each cohort over time. For example, you might look at how many users from each cohort are still active after one week, one month, etc. This helps identify trends and patterns in user behavior
Visualize the Data: Use charts and graphs to visualize the retention rates and other metrics for each cohort. This makes it easier to spot trends and compare different cohorts. If you don’t use 3rd party tools for checking the cohort analysis, using a tool like Looker Studio might be a good idea
These are the most commonly used by the growth teams, and they rely on this data to make strategic decisions. Active users are taken into account and cohort retention analysis is usually done based on the period they signed up or were active in the product, the most common time periods are days weeks, or months.
I personally find it to be very dangerous. It’s a one-sided approach to data, where it’s taken into account solely the engagement level of your user base and if they’re simply coming back, even if it’s just logging in without any additional action.
Let’s say you have a SaaS for Wood Manufacturing. Would it be important to you if you’re retaining a startup founder? Probably not, as it’s not the target audience. What if your retention rate is 80%, and the majority of the retained users are startup founders, would that be considered a success? Or would it be a success if your retention rate is 90%, but predominantly free users, where predominantly paying customers are not using your product any longer?
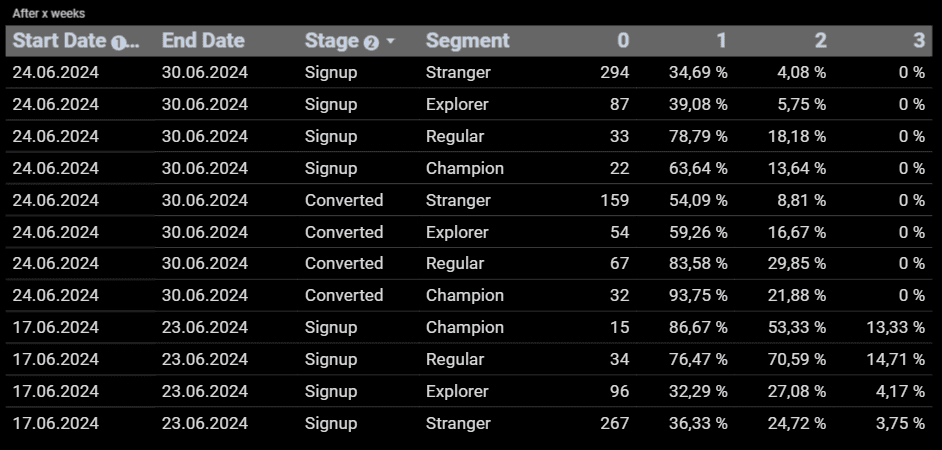
That’s why we’ve introduced a model that connects 3 essential aspects of each user:
User profile (based on 1st or 3rd party data)
User engagement level
Only by combining these 3, we get a full picture of what’s really happening with our paying customers and free users.
This is how it would look like now (the prototype of our new feature):
Traditional cohort analysis often focused solely on behavior, can be misleading. A more comprehensive approach is needed to understand the true health of your user base. By considering user profiles, engagement levels, and lifecycle stages, you can gain valuable insights into the behavior of your paying customers and free users. Our new model offers a more accurate and actionable perspective on retention, enabling you to make data-driven decisions that drive growth and success.
Cohort analysis for customer retention
The Customer Retention Rate (CRR) is a key metric that indicates the percentage of customers a company retains over a specific period (usually weeks). It helps businesses understand how well they are maintaining their customer base and is crucial for assessing the overall health and growth potential of a SaaS company.
Formula: CRR = ((Customers at End of Period - New Customers Acquired) / Customers at Start of Period) x 100%
Example: Let’s say you start a month with 1,000 customers. By the end of the month, you have 950 customers, and you acquired 100 new customers during that period. The CRR would be calculated as follows:
CRR = ((950-100) / 1000) x 100% = 85%
This means you’ve retained 85% of your customers over that month.
Importance:
Customer loyalty - A high CRR indicates that customers are satisfied with your SaaS and are likely to continue using it, leading to strong customer loyalty
Growth indicator - Consistently high retention rates combined with good acquisition, ensures constant and healthy growth of your user base. Also, satisfied customers are more likely to refer their peers and expand their usage. This is critical for SaaS to find product market fit
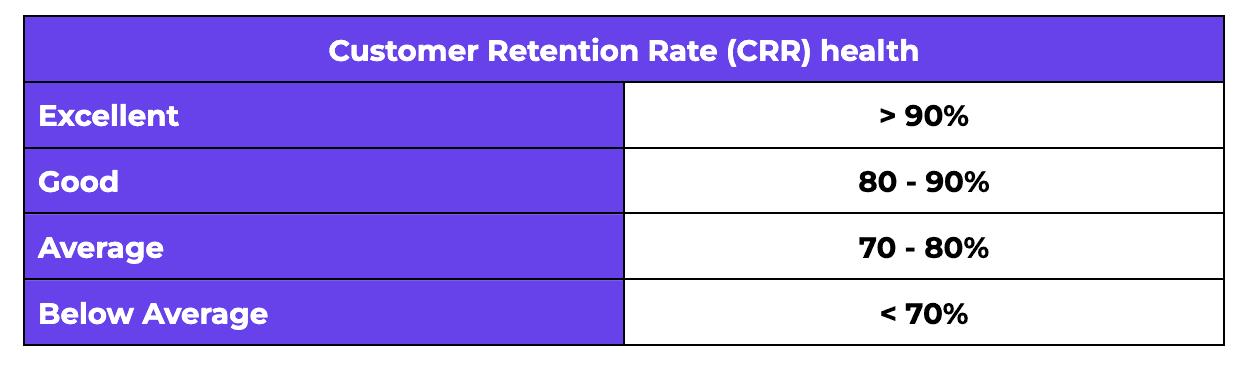
The quality of your customer retention could be evaluated by the following customer retention rates.
Excellent: A retention rate of 90% or higher is considered excellent
Good: A retention rate between 80% and 90% is considered good
Average: An average retention rate typically falls between 70% and 80%
Below Average: A retention rate below 70% indicates room for significant improvement
Examples of insights gained from cohort analysis
Cohort analysis can provide a wealth of insights that help businesses improve their strategies and operations. Here are some examples:
Identifying High-Performing Cohorts: By analyzing different cohorts, you can identify which groups of users are the most engaged or have the highest lifetime value. This can help you understand what factors contribute to their success and apply these insights to other cohorts
Pinpointing Churn Points: Cohort analysis can reveal when users are most likely to stop using your product or service. For example, you might find that users who don’t engage within the first week are more likely to churn. This insight can help you develop targeted interventions to improve retention
Evaluating the Impact of Changes: By comparing cohorts before and after a product update or marketing campaign, you can assess the impact of these changes. For instance, you might discover that a new feature significantly improves user retention for certain cohorts
Seasonal Trends: Cohort analysis can help you identify seasonal trends in user behavior. For example, you might find that users acquired during the holiday season have different engagement patterns compared to those acquired at other times of the year
Optimizing Marketing Strategies: Insights from cohort analysis can inform your marketing strategies by highlighting which channels or campaigns are most effective at acquiring high-value users. This allows you to allocate your marketing budget more efficiently
Improving Product Features: By understanding how different cohorts interact with your product, you can identify areas for improvement. For example, if a particular feature is underutilized by a specific cohort, you might consider redesigning it to better meet their needs
Tools for Cohort Analysis
1. Hyperaktiv
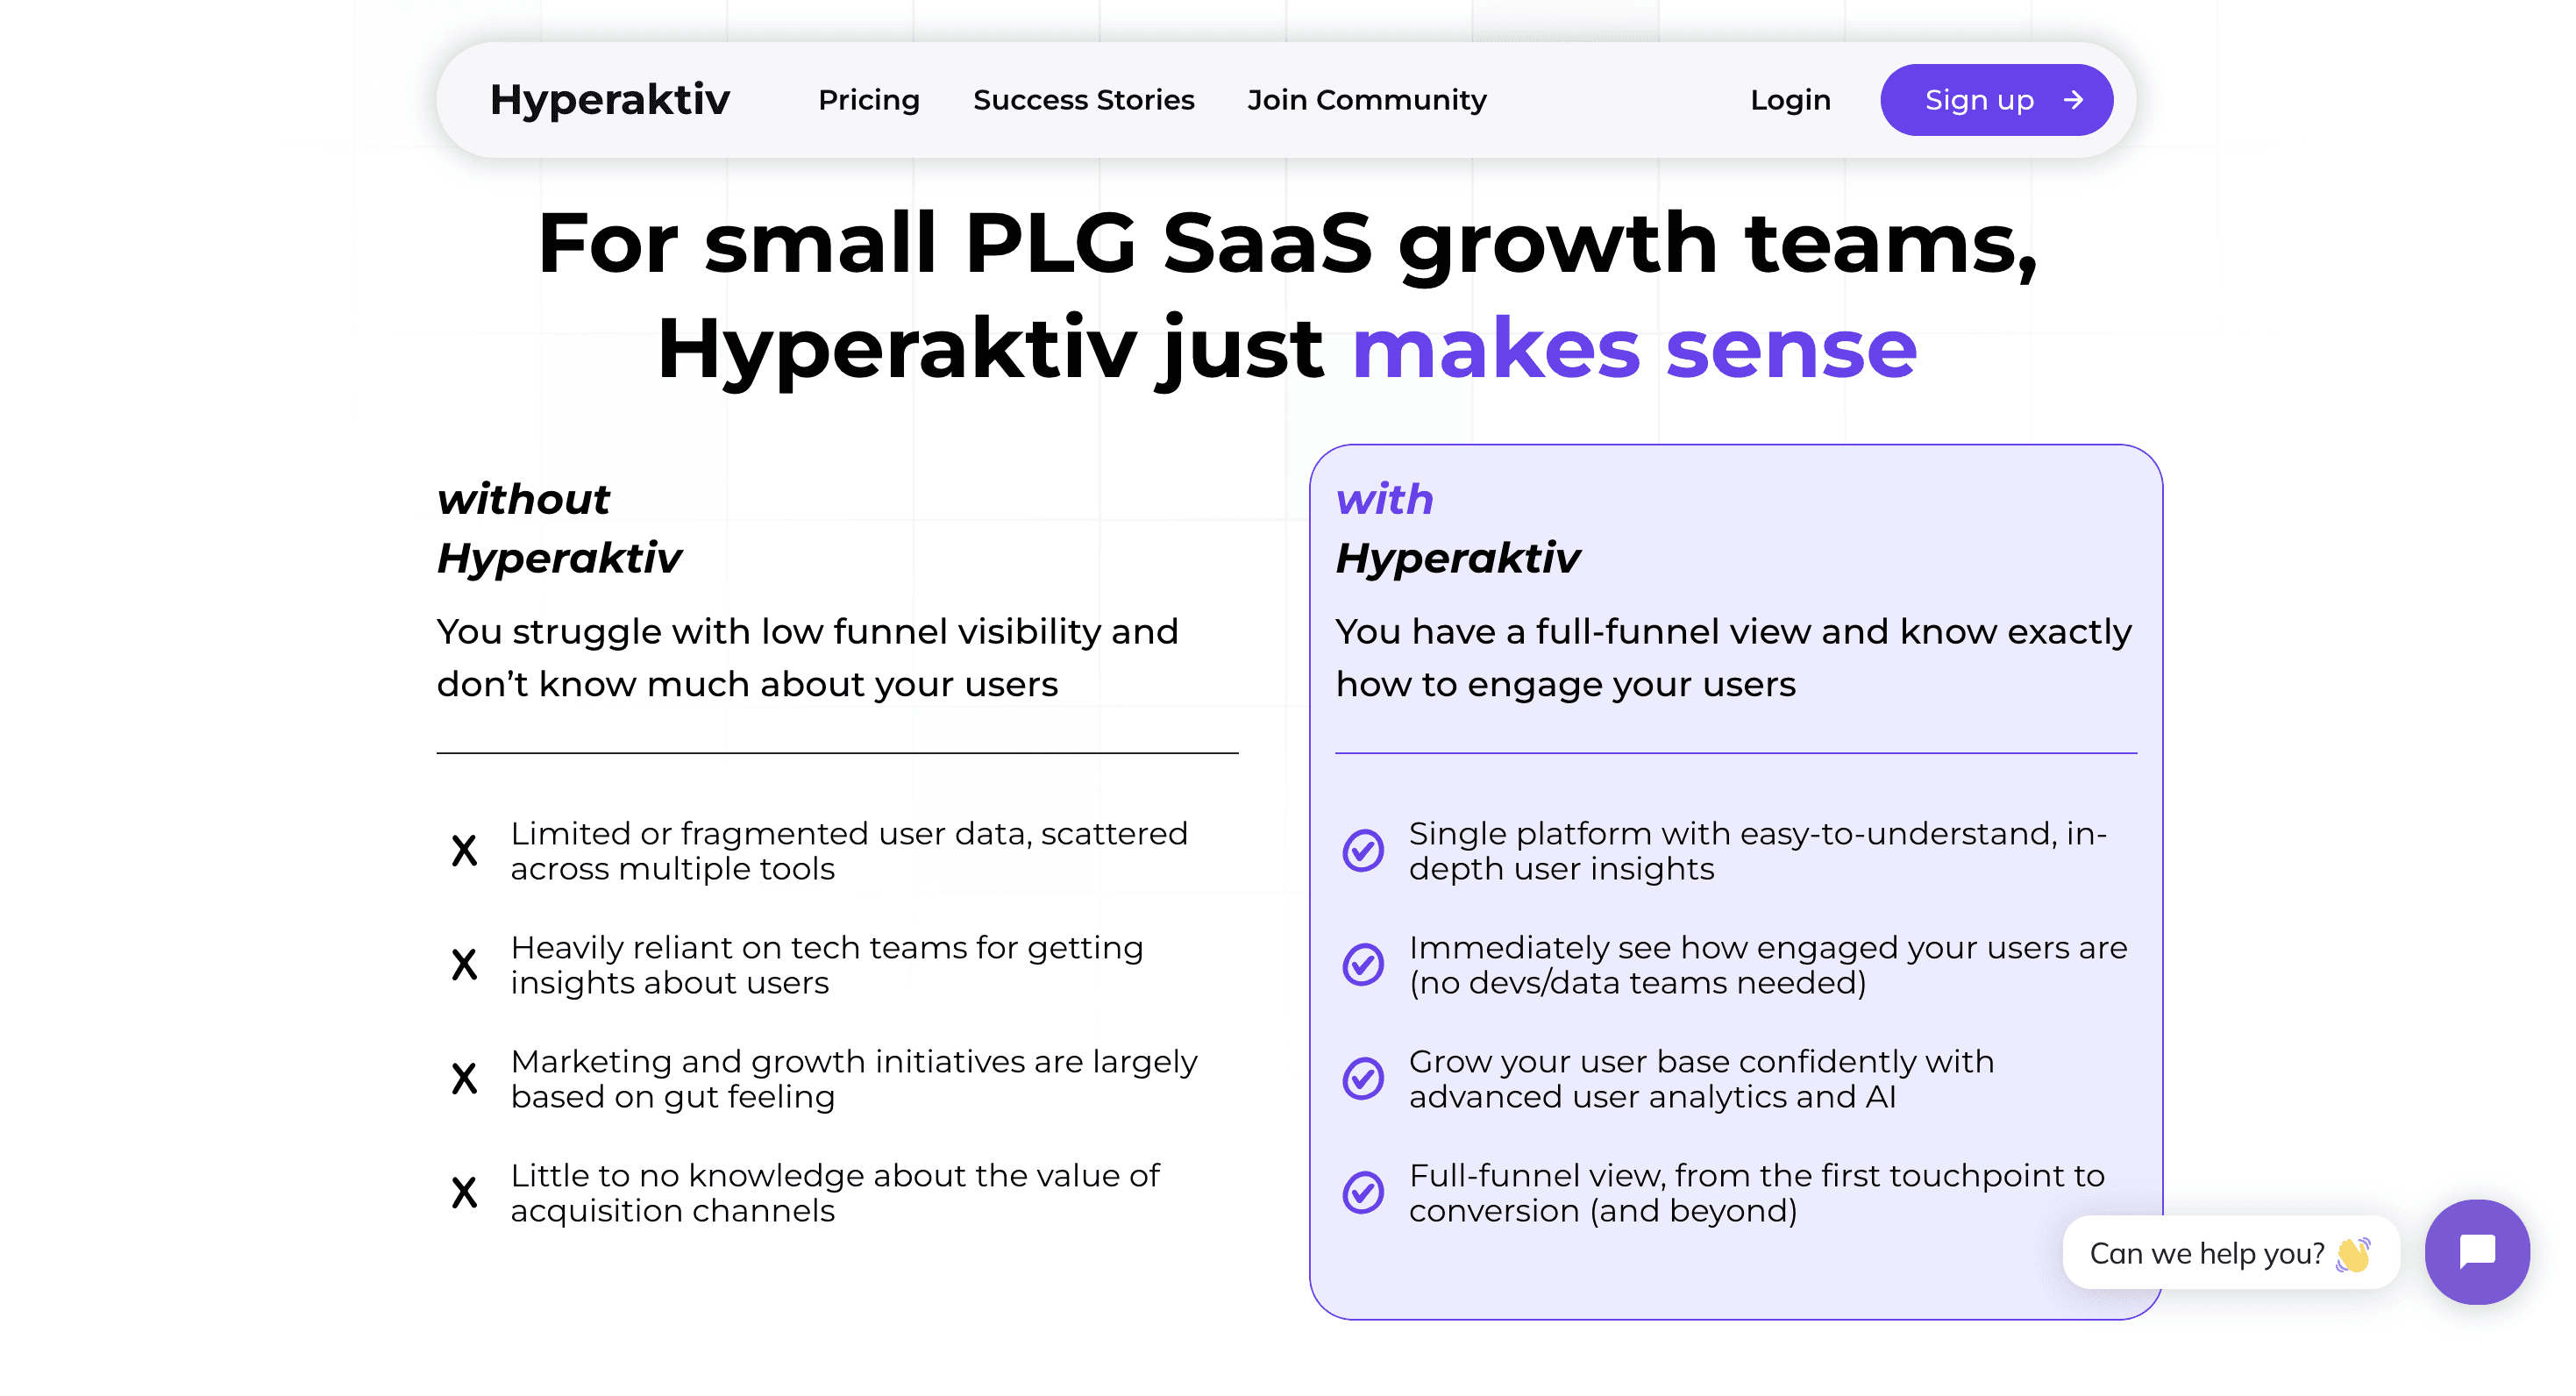
Hyperaktiv offers a streamlined cohort analysis feature that enables small to medium SaaS companies to quickly segment users and derive actionable insights to enhance engagement and conversion.
Pros
Rapid implementation and user-friendly interface
Holistic user journey tracking
Actionable insights with specific recommendations
Efficient acquisition channel evaluation
Unique segmentation capability: The only tool that allows you to segment users and see engagement and ICP match in each lifecycle stage
Cons
Limited chart-building capabilities
Focused primarily on PLG SaaS businesses, which may limit applicability for other industries
Pricing: Free tier available with basic features. Paid plans start at €49/month.
2. Mixpanel
Mixpanel is a powerful analytics tool that offers detailed cohort analysis, allowing you to track user behavior and retention over time.
Pros
User-friendly interface with customizable dashboards
Advanced segmentation and filtering options
Real-time data tracking and reporting
Cons
Can be expensive for smaller businesses
Steeper learning curve for advanced features
Pricing: Starts with a free tier for up to 100K monthly tracked users. Paid plans begin at $25/month for additional features and higher usage limits.
3. Amplitude
Amplitude is known for its robust analytics capabilities, including cohort analysis, which helps you understand user behavior and improve retention.
Pros
Intuitive interface with powerful data visualization tools
Comprehensive behavioral analytics
Strong support and community resources
Cons
Higher cost for advanced features
Can be complex for beginners
Pricing: Free tier available with basic features. Paid plans start at $995/month for more advanced analytics and higher data limits.
4. Google Analytics
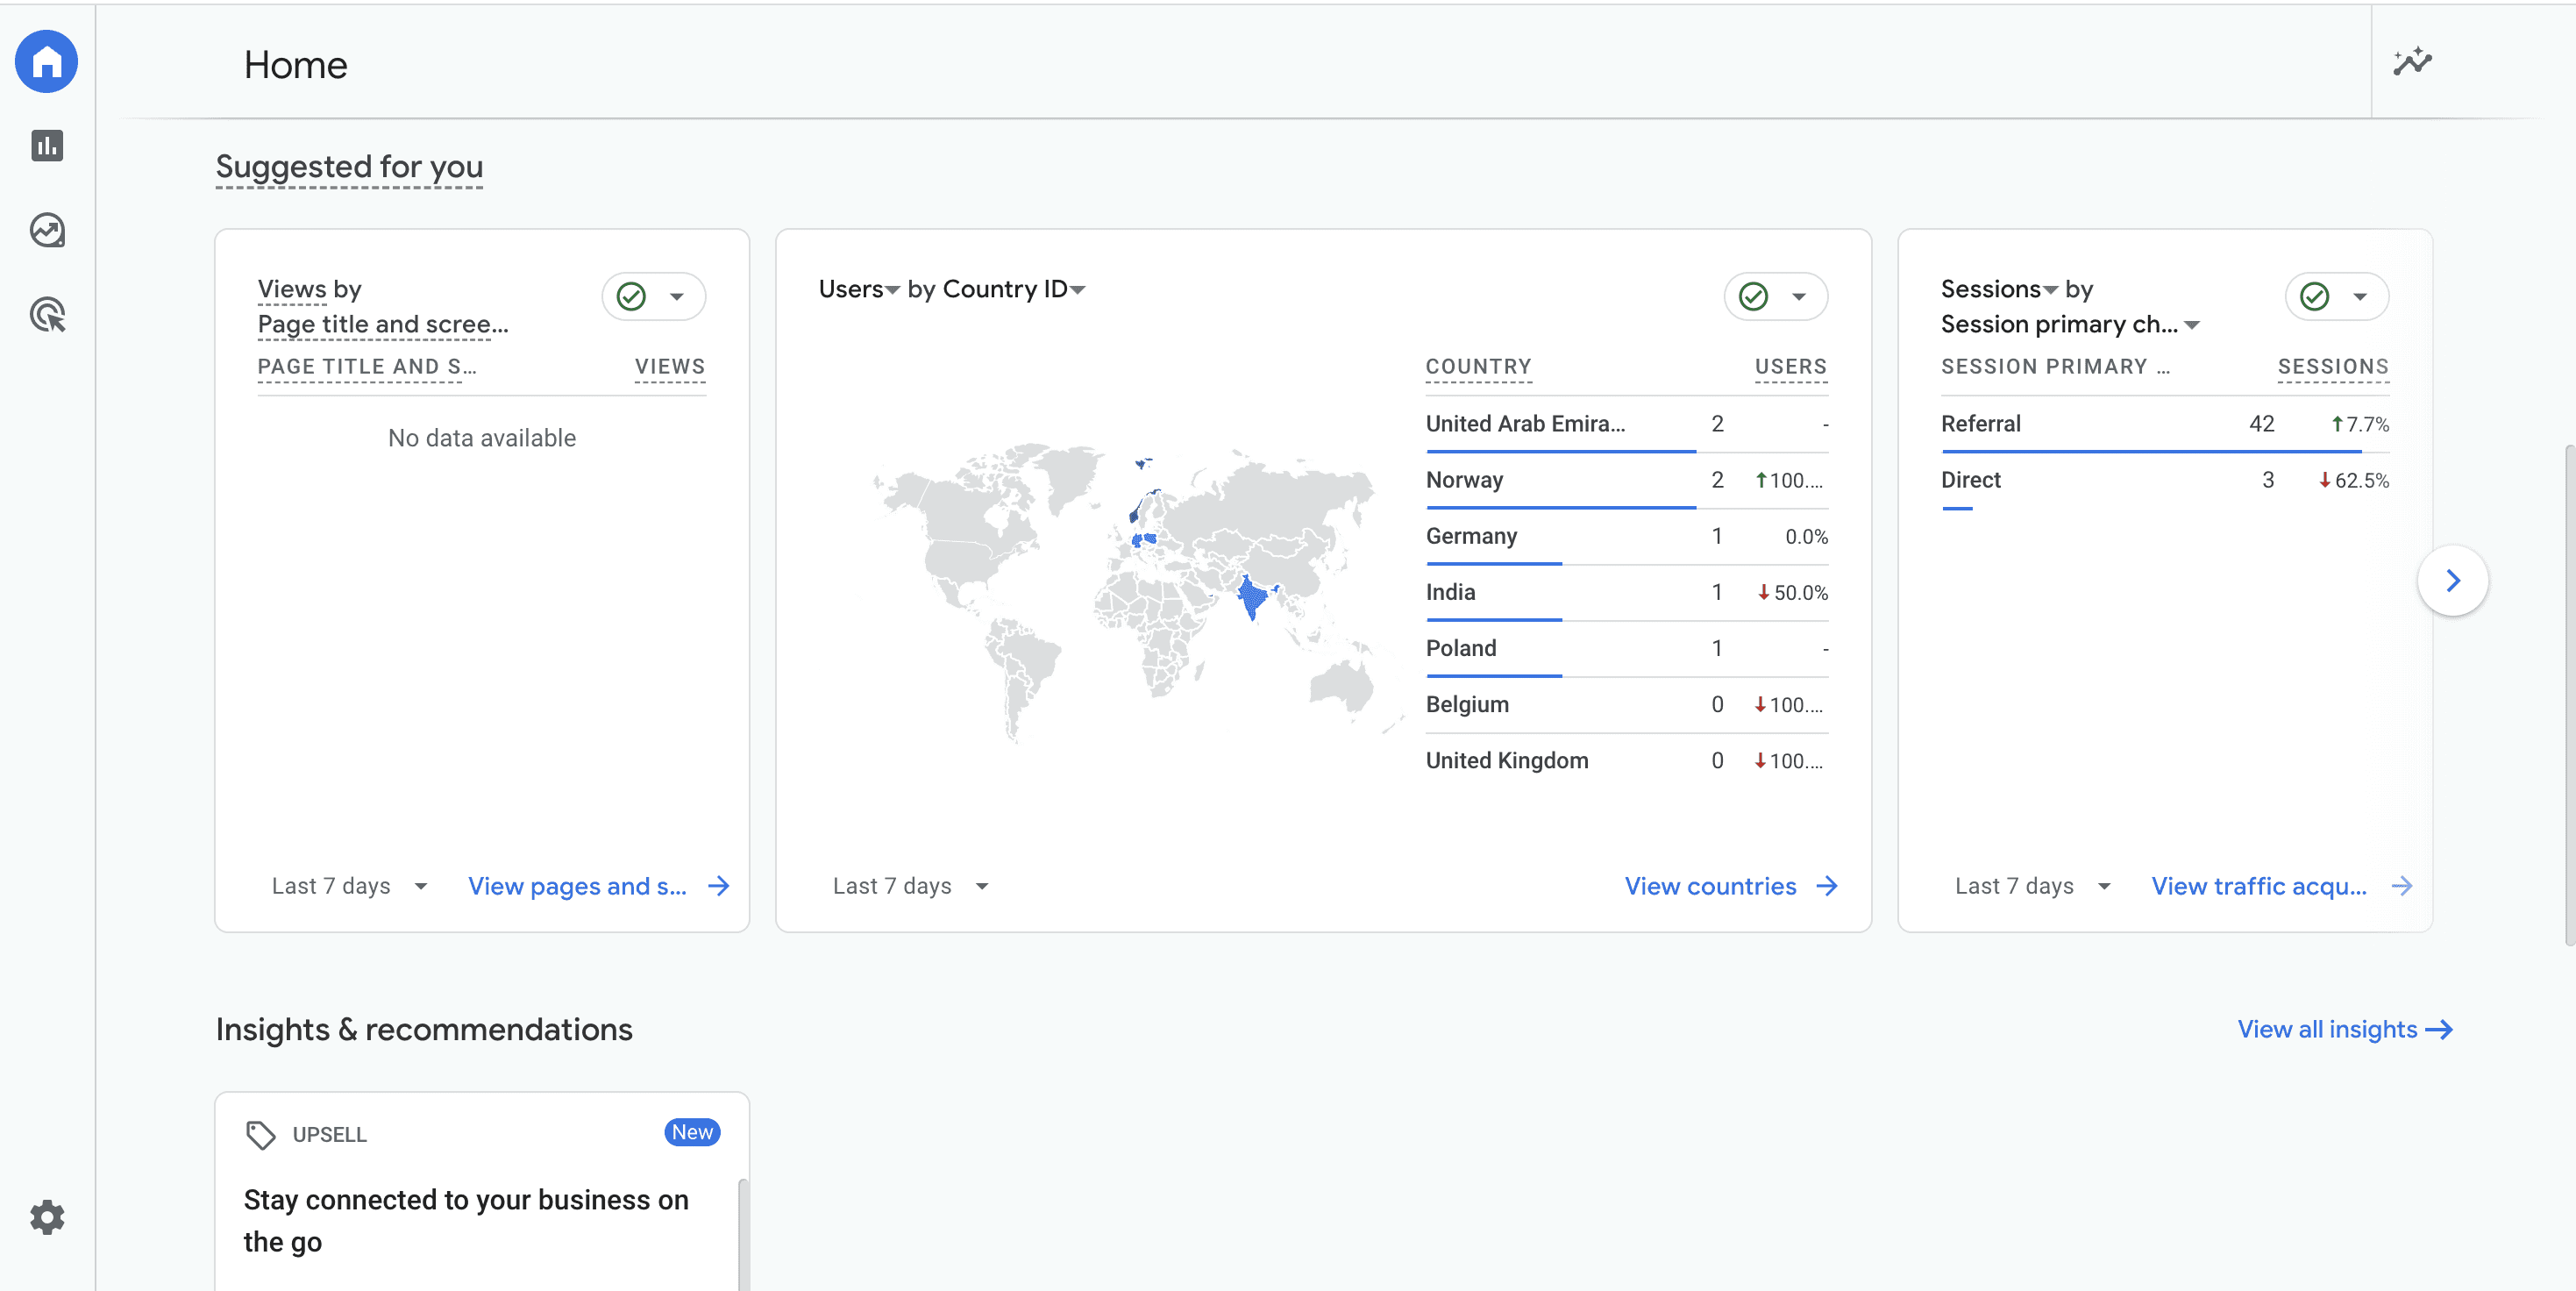
Google Analytics is a widely used tool that offers basic cohort analysis features, making it accessible to many businesses.
Pros
Free to use with extensive documentation and support
Integrates well with other Google services
Suitable for basic cohort analysis needs
Cons
Limited advanced cohort analysis features
Can be overwhelming due to the sheer number of features
Pricing: Free for most users. Google Analytics 360, the premium version, starts at $150,000/year.
5. PostHog
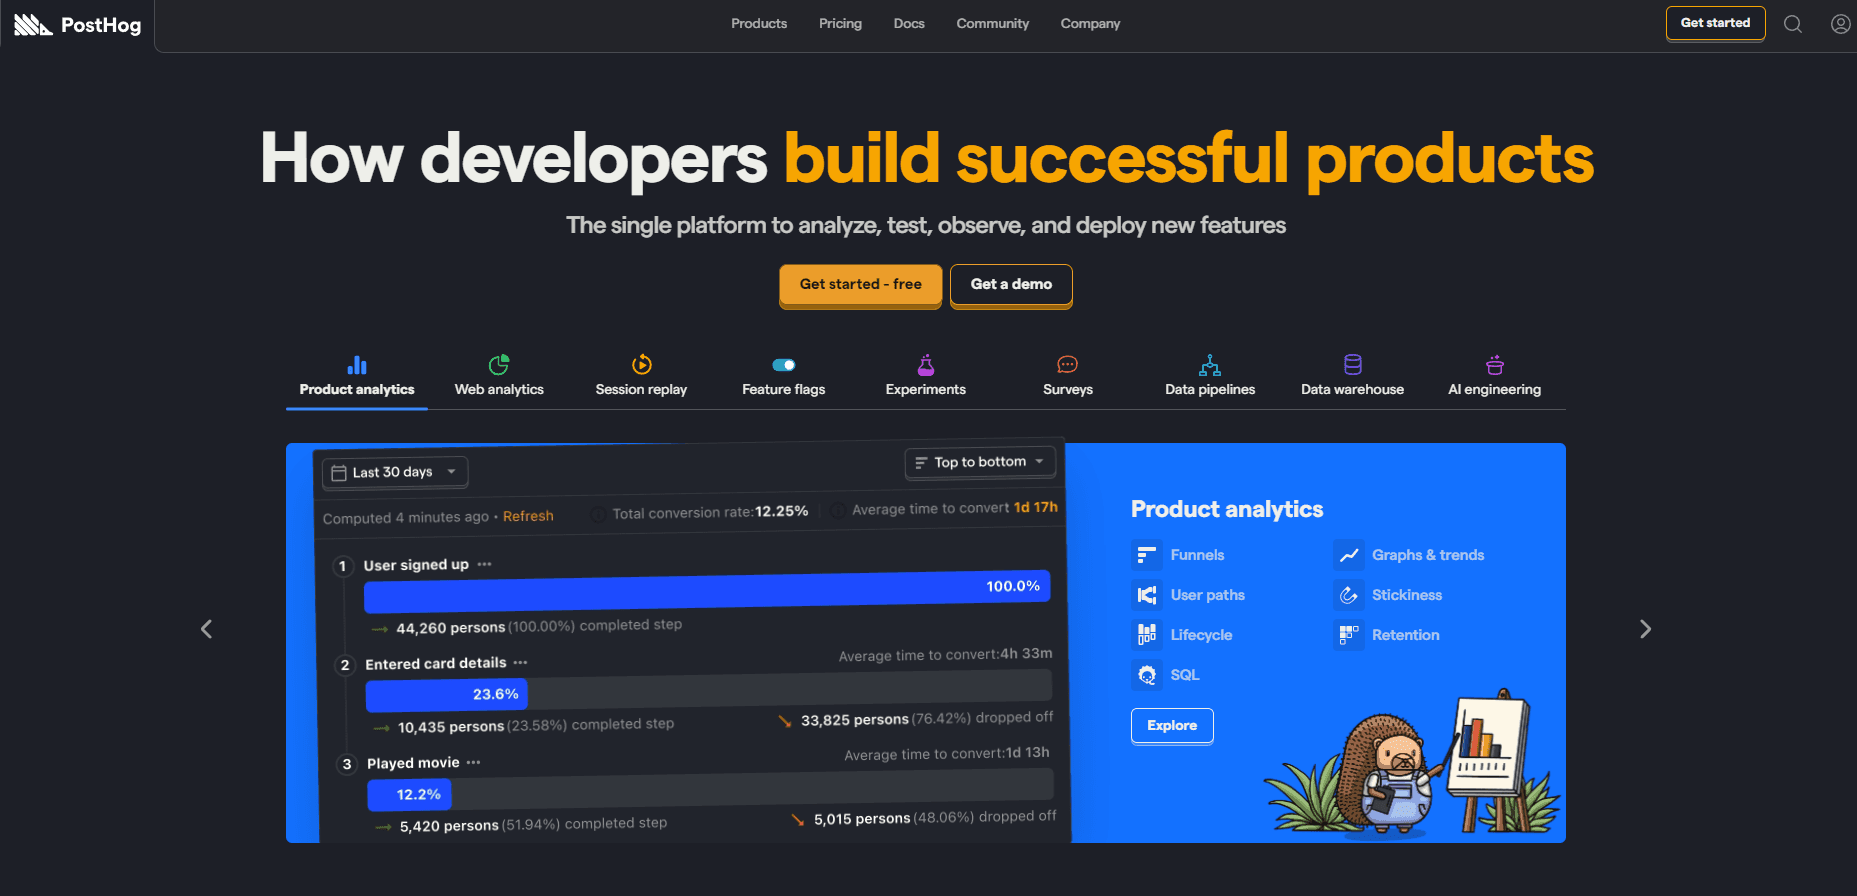
PostHog is an open-source product analytics platform that includes robust cohort analysis features, allowing you to group users based on shared characteristics and analyze their behavior over time.
Pros
Open-source and highly customizable
Comprehensive analytics with features like session replays, feature flags, and A/B testing
No data limits, making it suitable for large datasets
Cons
Requires technical expertise to set up and maintain
Limited customer support compared to commercial tools