
SaaS Retention Analysis 101: Real-World Examples and Tips

by
Aleksa Mitrović
Sep 13, 2024
Identify and convert your most valuable users

Sign Up
What is retention in SaaS?
For a SaaS product, new users are constantly signing up. For a PLG SaaS, anywhere from 10 up to tens of thousands of daily registrations. Great job! You’ve nailed down the user acquisition.
The next big goal in the funnel is to retain those users.
Retention in SaaS refers to the ability of a company to keep its users or customers over a period of time. It’s a crucial metric because it indicates the health and satisfaction of the user base.
Retention is usually expressed as a percentage of users or customers who continue to use and pay for a SaaS product over a specified period.

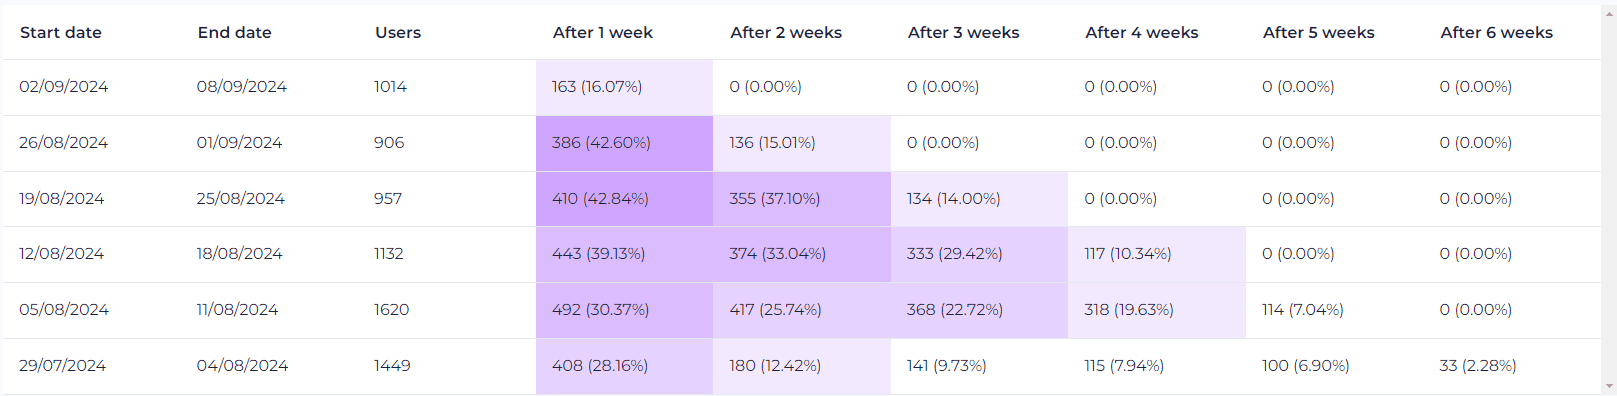
Retention analysis usually looks like in the pic above. This is most commonly used by the growth teams, and they rely on this data to make strategic decisions. Active users are taken into account and cohort retention analysis is usually done based on the period they signed up or were active in the product, the most common time periods are days weeks, or months.
I personally find it to be very dangerous. It’s a one-sided approach to data, where it’s taken into account solely the engagement level of your user base and if they’re simply coming back, even if it’s just logging in without any additional action.
Let’s say you have a SaaS for Wood Manufacturing. Would it be important to you if you’re retaining a startup founder? Probably not, as it’s not the target audience. What if your retention rate is 80%, and the majority of the retained users are startup founders, would that be considered a success? Or would it be a success if your retention rate is 90%, but predominantly free users, where predominantly paying customers are not using your product any longer?
That’s why we’ve introduced a model that connects 3 essential aspects of each user:
User profile (based on 1st or 3rd party data)
User engagement level
Only by combining these 3, we get a full picture of what’s really happening with our paying customers and free users.
This is how it would look like now (the prototype of our new feature):
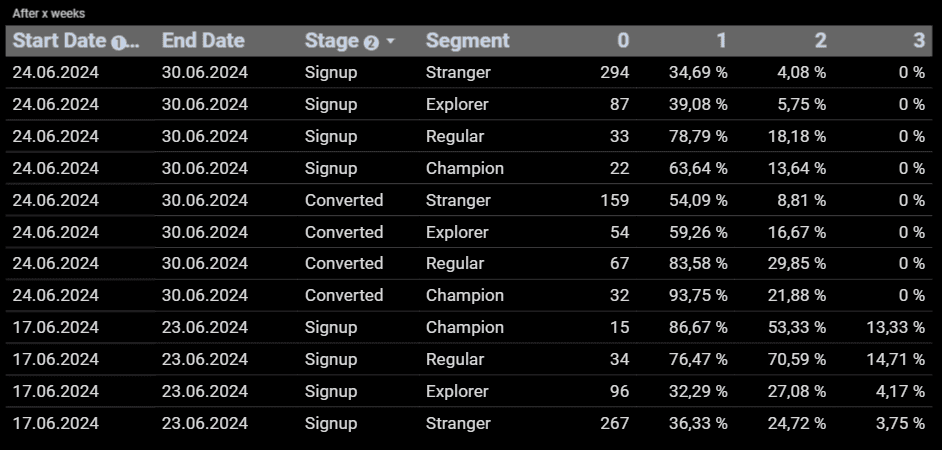
Traditional retention analysis often focused solely on user engagement and return rates, can be misleading. A more comprehensive approach is needed to understand the true health of your user base. By considering user profiles, engagement levels, and lifecycle stages, you can gain valuable insights into the behavior of your paying customers and free users. Our new model offers a more accurate and actionable perspective on retention, enabling you to make data-driven decisions that drive growth and success.
How to measure retention in SaaS
Analyzing customers' behaviors and tracking retention metrics can help businesses identify strategies to improve retention and increase the number of customers over time.
There are 4 most common ways to measure various retention aspects in SaaS, depending on the maturity of the company and the product you might prioritize them differently.
Usually focus at the early stage:
Customer Retention Rate (CRR)
Formula: CRR = ((Customers at End of Period - New Customers Acquired) / Customers at Start of Period) x 100%
Example: Let’s say you start a month with 1,000 customers. By the end of the month, you have 950 customers, and you acquired 100 new customers during that period. The CRR would be calculated as follows:
CRR = ((950-100) / 1000) x 100% = 85%
This means you’ve retained 85% of your customers over that month.
Purpose: The Customer Retention Rate (CRR) is a key metric that indicates the percentage of customers a company retains over a specific period (usually weeks). It helps businesses understand how well they are maintaining their customer base and is crucial for assessing the overall health and growth potential of a SaaS company
Importance:
Customer loyalty - A high CRR indicates that customers are satisfied with your SaaS and are likely to continue using it, leading to strong customer loyalty
Growth indicator - Consistently high retention rates combined with good acquisition, ensures constant and healthy growth of your user base. Also, satisfied customers are more likely to refer their peers and expand their usage. This is critical for SaaS to find product market fit
Customer Churn Rate (Churn)
Formula: Churn = (Customers Lost During Period / Customers at Start of Period) x 100%
Examples: Let’s say you start a month with 1,000 customers. During that month, you lose 50 customers. The Churn Rate would be calculated as follows:
Churn = (50 / 1000) x 100% = 5%
This means 5% of your customers canceled their subscription during that month.
Purpose: The Customer Churn Rate measures the percentage of customers who cancel their subscription within a given period. It’s a critical metric for SaaS companies as it directly impacts revenue and growth potential.
Importance:
Revenue levels - High churn rates can significantly reduce recurring revenue, making it harder to achieve financial stability and growth
Business Sustainability & Cost of Acquisition - Since acquiring new customers is typically more expensive than retaining existing ones, a high churn rate can increase overall customer acquisition costs
Usually focus at the later stage:
Customer Lifetime Value (LTV)
Formula: LTV = Average Revenue Per User (ARPU) x Customer Lifetime
Example: Let’s say that your Average Revenue Per User (ARPU) is $100 and that the average Customer Lifetime is 12 months
LTV = $100 x 12 = $1,2000
This means that the LTV of your customers is $1,200.
Purpose: Customer Lifetime Value (LTV) estimates the total revenue a customer is expected to generate during their entire relationship with your company. It’s a crucial metric for understanding the long-term value of your customer base and guiding strategic decisions.
Importance:
Revenue Forecasting: LTV helps in predicting future revenue and planning long-term business strategies
Marketing Spend: By knowing the LTV, you can determine how much you can afford to spend on acquiring new customers while remaining profitable
Customer Segmentation: Identifying high-LTV customers allows you to focus your efforts on retaining and nurturing these valuable segments
Net Revenue Retention (NRR)
Formula: NRR = ((MRR at End of Period + Expansion MRR - Churned MRR) / MRR at Start of Period) x 100%
Example: Let’s say at the start of the month, your MRR is $100,000. By the end of the month, your MRR is $110,000. During the month, you gained $15,000 from upsells and cross-sells (Expansion MRR) but lost $5,000 due to churn (Churned MRR). The NRR would be calculated as follows:
NRR = (($110,000 + $15,000 - $5,000) / $100,000) x 100% = 120%
Purpose: Net Revenue Retention (NRR) reflects the percentage of recurring revenue retained from existing customers over a specific period, including any upsells, cross-sells, and downgrades. It provides a comprehensive view of how well a SaaS business is growing its revenue from its existing customer base.
Importance:
Revenue Growth: A high NRR indicates that the company is not only retaining its customers but also successfully expanding its revenue through upsells and cross-sells
Business Health: NRR is a strong indicator of the overall health and sustainability of a SaaS business, as it shows the ability to grow revenue without relying solely on new customer acquisition
What is a good retention rate for a SaaS company?
Customer Retention Rate (CRR)
Excellent: A retention rate of 90% or higher is considered excellent
Good: A retention rate between 80% and 90% is considered good
Average: An average retention rate typically falls between 70% and 80%
Below Average: A retention rate below 70% indicates room for significant improvement

Customer Churn Rate
Excellent: A churn rate of less than 1% monthly is considered excellent
Good: A churn rate between 1% and 2% monthly is considered good
Average: An average churn rate typically falls between 2% and 5% monthly
Below Average: A churn rate above 5% monthly indicates room for significant improvement

Customer Lifetime Value (LTV)
Excellent: An LTV to CAC ratio of 4:1 or higher is considered excellent
Good: An LTV to CAC ratio between 3:1 and 4:1 is considered good
Average: An average LTV to CAC ratio typically falls between 2:1 and 3:1
Below Average: An LTV to CAC ratio below 2:1 indicates room for significant improvement

Net Revenue Retention (NRR)
Excellent: An NRR of 120% or higher is considered excellent
Good: An NRR between 100% and 120% is considered good
Average: An average NRR typically falls between 90% and 100%
Below Average: An NRR below 90% indicates room for significant improvement

How to increase retention in SaaS?
There are various strategies for how you can improve individual retention KPIs. In this article, we will focus on the holistic approach towards all-round retention.
1. Enhance Customer Experience:
Exceptional Support: Provide prompt and effective customer service to resolve issues and build trust
Personalized Engagement: Tailor communication and offers to individual customer needs
Proactive Communication: Keep customers informed about product updates and best practices
2. Continuous Improvement:
Regular Updates: Continuously improve the product based on customer feedback
Product Value: Ensure the product meets evolving customer needs and expectations
3. Customer Loyalty and Engagement:
Loyalty Programs: Implement incentives for long-term customers
Customer Success Programs: Help customers achieve their goals with your product
4. Revenue Generation:
Upselling and Cross-selling: Offer complementary products or services
Customer Engagement: Foster ongoing engagement to increase customer lifetime value (LTV)
By focusing on these areas, you can effectively improve customer retention rates (CRR), reduce churn rates, increase LTV, and enhance overall business health.
Consistent monitoring and analysis of these KPIs are essential for identifying areas that need improvement and measuring the effectiveness of your retention strategies.