
Google Analytics vs. Posthog: A Comprehensive Comparison

by
Wiktoria Slowikowska
Oct 18, 2024
Identify and convert your most valuable users

Sign Up
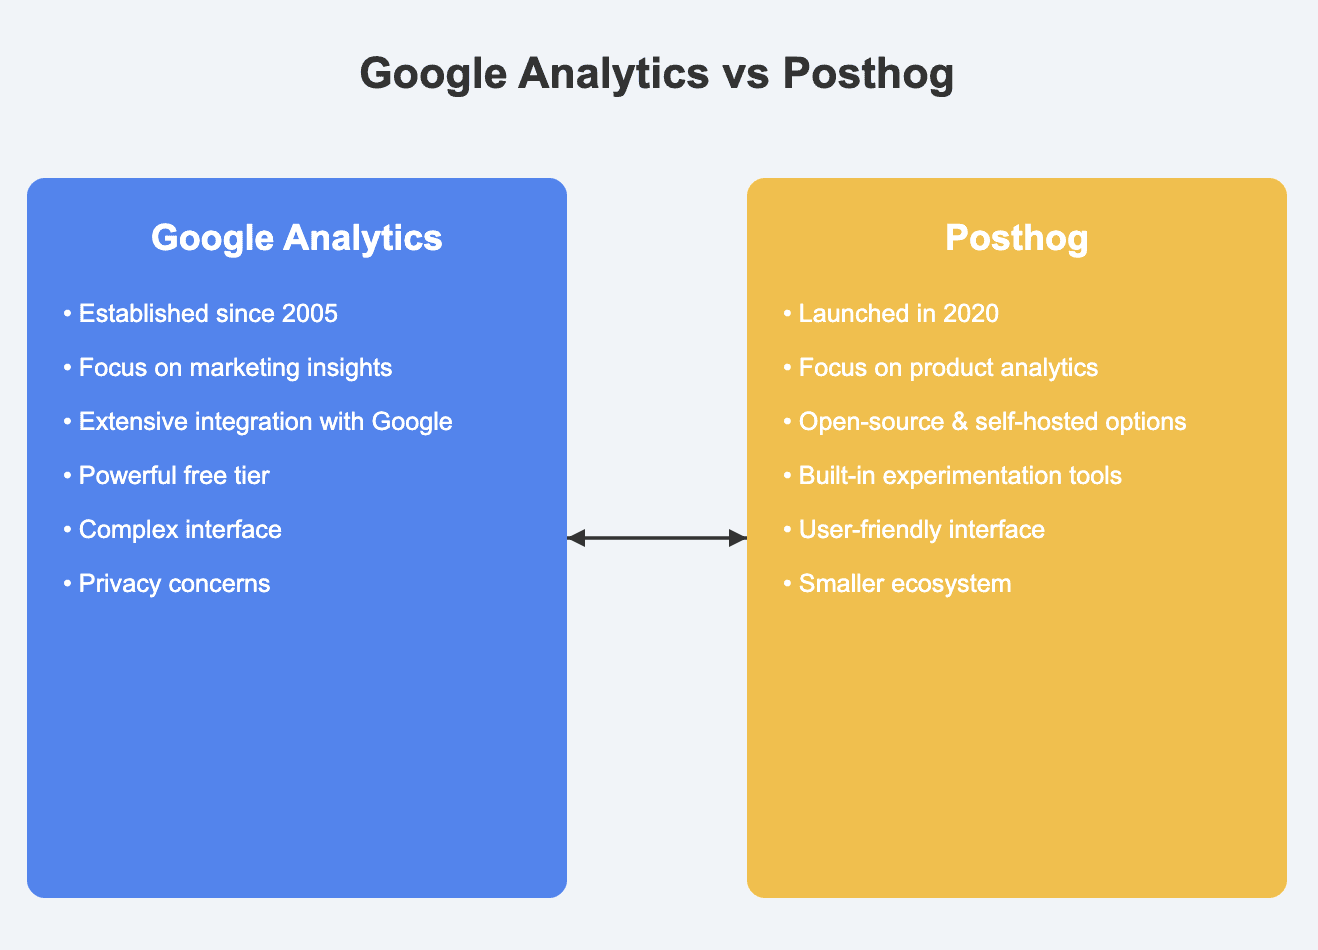
Selecting the appropriate analytics tool is crucial for making informed decisions and driving product success. This article provides an in-depth comparison of two prominent players in the product analytics space: Google Analytics and Posthog. We'll explore their features, strengths, limitations, ideal use cases, and pricing structures to help you make an informed decision for your organization's needs.
Google Analytics
Google Analytics, introduced in 2005, is a web analytics service offered by Google. Initially focused on marketing and audience insights, it has evolved significantly over the years to include product-specific features. The latest iteration, Google Analytics 4 (GA4), represents a shift towards a more flexible, event-based data model that can be applied to both websites and mobile applications.
Key Features
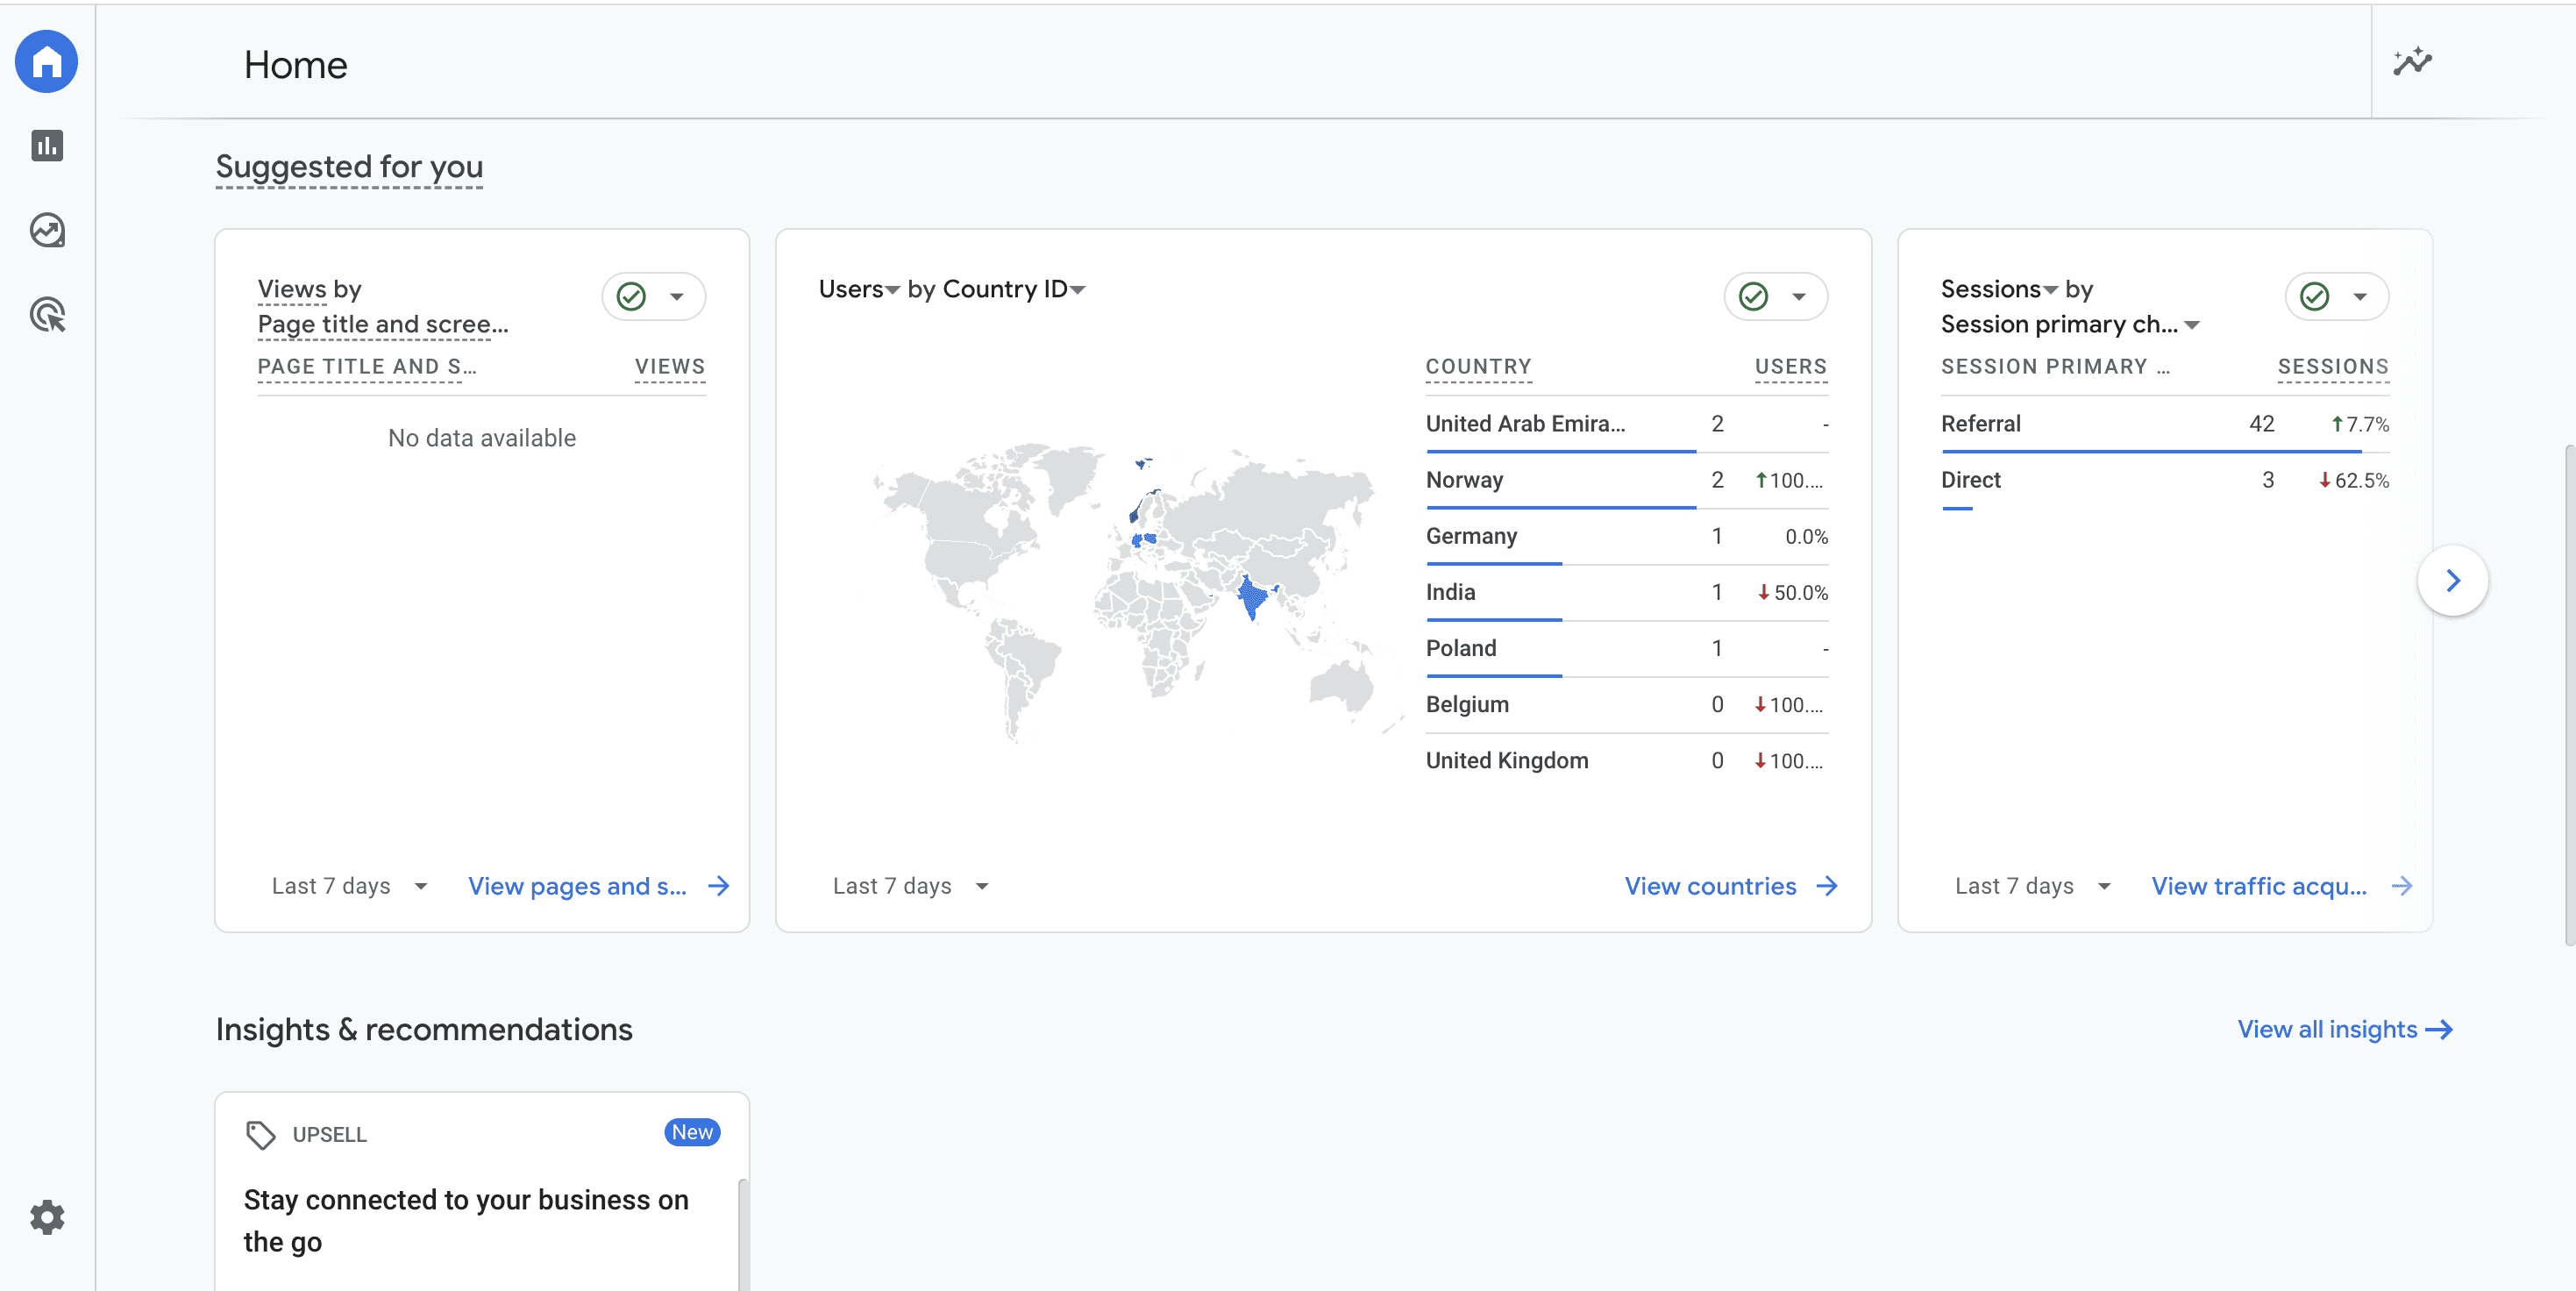
Real-time Data Reporting: Google Analytics provides live updates on website activity. Users can view current site visitors, page views, and user actions as they occur. This feature is particularly useful for monitoring immediate impacts of marketing campaigns or tracking live event participation.
Audience Insights and Segmentation: The platform offers detailed information about user demographics, interests, and behaviors. It allows for the creation of specific audience segments, enabling targeted marketing efforts and informed product development decisions based on user characteristics.
Conversion Tracking and Goal Setting: Users can define specific actions as goals (e.g., purchases, sign-ups, downloads) and track conversion rates. This feature helps measure the effectiveness of a website in achieving business objectives and identifies areas for improvement in the user journey.
Custom Report Creation: Google Analytics enables users to create tailored reports that combine specific metrics and dimensions. This customization allows businesses to focus on the most relevant data for their needs, facilitating more efficient data analysis and decision-making.
Mobile App Analytics: Through integration with Firebase, Google Analytics offers comprehensive mobile app performance tracking. This includes user engagement metrics, stability issues, and app-specific conversion rates, providing a complete view of both web and mobile digital presence.
Pros and Cons
Pros:
Extensive documentation and large community support
Powerful integration with Google's advertising and marketing ecosystem
Advanced machine learning capabilities for automated insights
Robust free tier with comprehensive features
Familiar interface and metrics for marketing professionals
Cons:
Privacy concerns related to data being processed on Google's servers
Limited raw data access in the standard version
Less focus on product-specific metrics compared to dedicated product analytics tools
Sampling of data in high-traffic scenarios, potentially affecting accuracy
Who is it for?
Google Analytics is well-suited for:
Marketing teams focused on acquisition, audience analysis, and conversion optimization
Large enterprises with complex, multi-platform tracking needs
Organizations heavily invested in the Google ecosystem (e.g., Google Ads, Google Marketing Platform)
Companies requiring advanced integration with advertising platforms
Businesses seeking a balance between marketing and basic product analytics
Pricing
Google Analytics 4 (GA4)
Free for most users
Unlimited data collection
Sampling applied to reporting for high-volume properties
Google Analytics 360 (Enterprise version)
Starting at $150,000 per year
Unsampled reporting
Advanced tools and integrations
Dedicated support
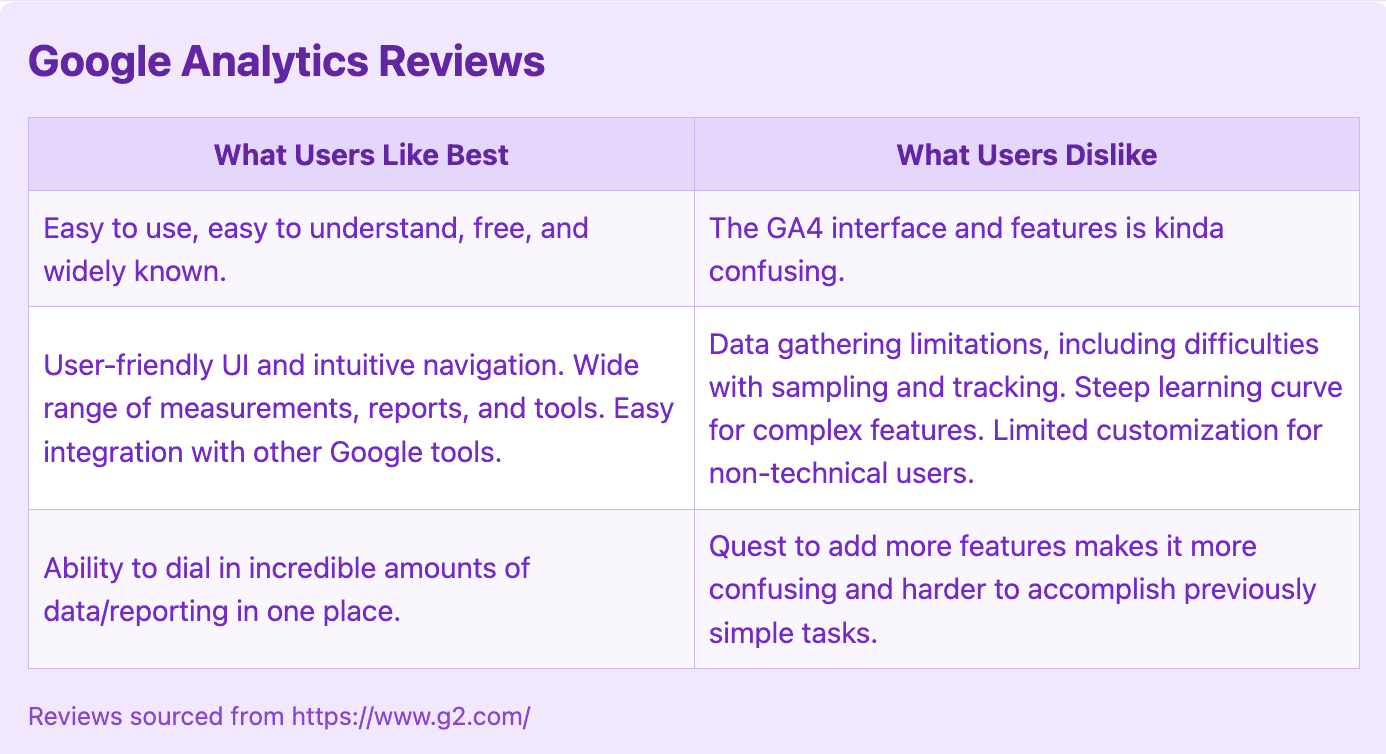
What do customers say?
Here's what customers are saying about Google Analytics, highlighting both its strengths and areas for improvement:
Posthog
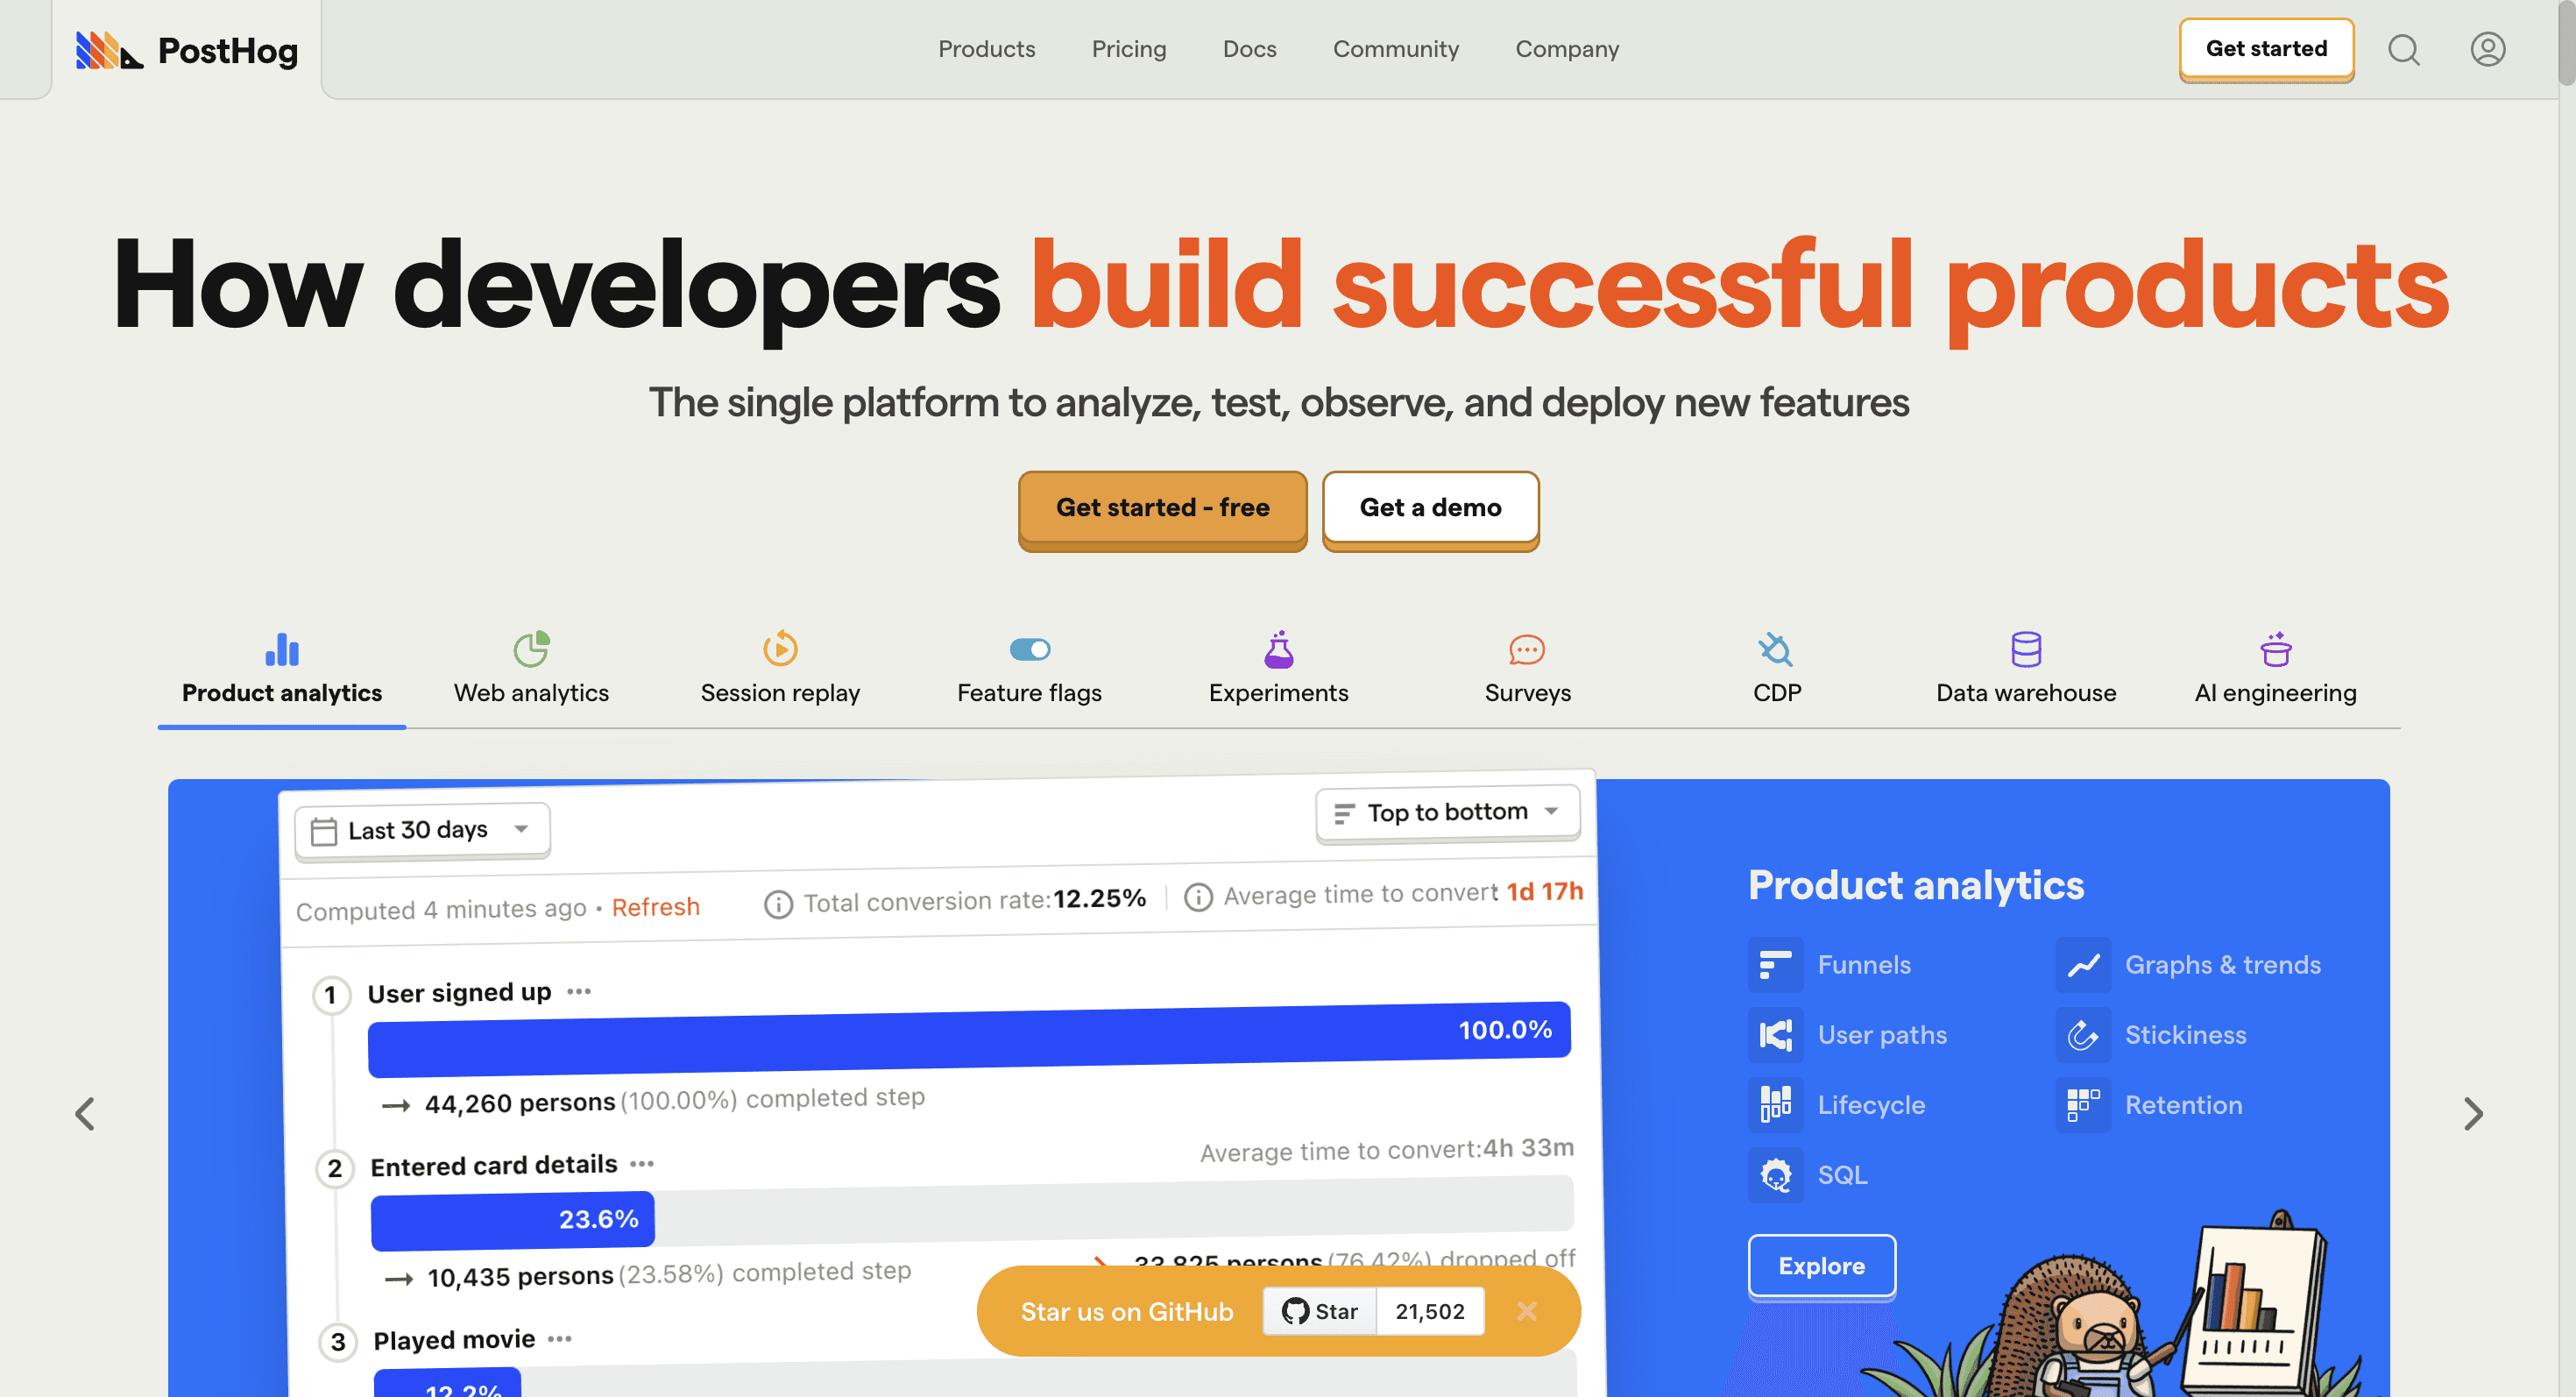
Posthog, launched in 2020, is an open-source product analytics platform designed to help teams understand user behavior and product usage. It offers a comprehensive suite of tools for tracking events, analyzing user journeys, and conducting experiments. Posthog distinguishes itself with its focus on product teams and its commitment to data privacy through self-hosting options.
Key Features
Event Tracking and User Journeys: Posthog tracks individual user actions and the sequence of these actions within a product. This feature allows businesses to analyze user paths from initial interaction to conversion or drop-off, helping identify and address bottlenecks in the user experience.
Feature Flags for A/B Testing: The platform includes feature flags that allow for controlled rollout of new features. Users can enable or disable features for different user segments, facilitating A/B testing, gradual feature releases, and quick iterations based on user feedback.
Session Recording and Heatmaps: Posthog offers session recording functionality, capturing user interactions within the product. Coupled with heatmaps that visualize click and scroll patterns, this feature provides detailed insights into user behavior and highlights potential usability issues.
User Cohort Analysis: The cohort analysis feature allows grouping of users based on shared characteristics or behaviors. It enables tracking of how different user groups behave over time, which is particularly valuable for analyzing user retention and identifying factors that contribute to long-term engagement.
Self-hosted Option: Posthog provides a self-hosting option, allowing organizations to run the analytics platform on their own infrastructure. This feature offers enhanced data control and can help address specific data privacy requirements or regulations.
Pros and Cons
Pros:
User-friendly interface designed specifically for product teams
Comprehensive suite of product analytics and experimentation tools
Self-hosting option for enhanced data privacy and control
Open-source nature allowing for customization and community-driven development
Built-in experimentation and feature flag capabilities
Cons:
Younger platform with a smaller ecosystem of integrations
Potentially higher technical overhead, especially for self-hosted deployments
Less comprehensive marketing-focused features compared to Google Analytics
Smaller community and knowledge base compared to more established tools
May require more resources to maintain and scale for large enterprises
Who is it for?
Posthog is ideal for:
Product-led growth companies prioritizing user behavior and product usage analysis
Startups and scale-ups requiring flexible, customizable analytics solutions
Development teams seeking integrated feature flag and experimentation tools
Organizations with stringent data privacy requirements or preferences for self-hosting
Companies looking for open-source solutions with the potential for customization
Pricing
Open Source (Self-hosted)
Free
Unlimited events and users
Community support
Cloud
Free tier: Up to 1 million events per month
Team tier: Starting at $450 per month for up to 1 million tracked users
Enterprise tier: Custom pricing for larger organizations
Self-hosted Enterprise
Custom pricing
Premium support and services
Advanced security features
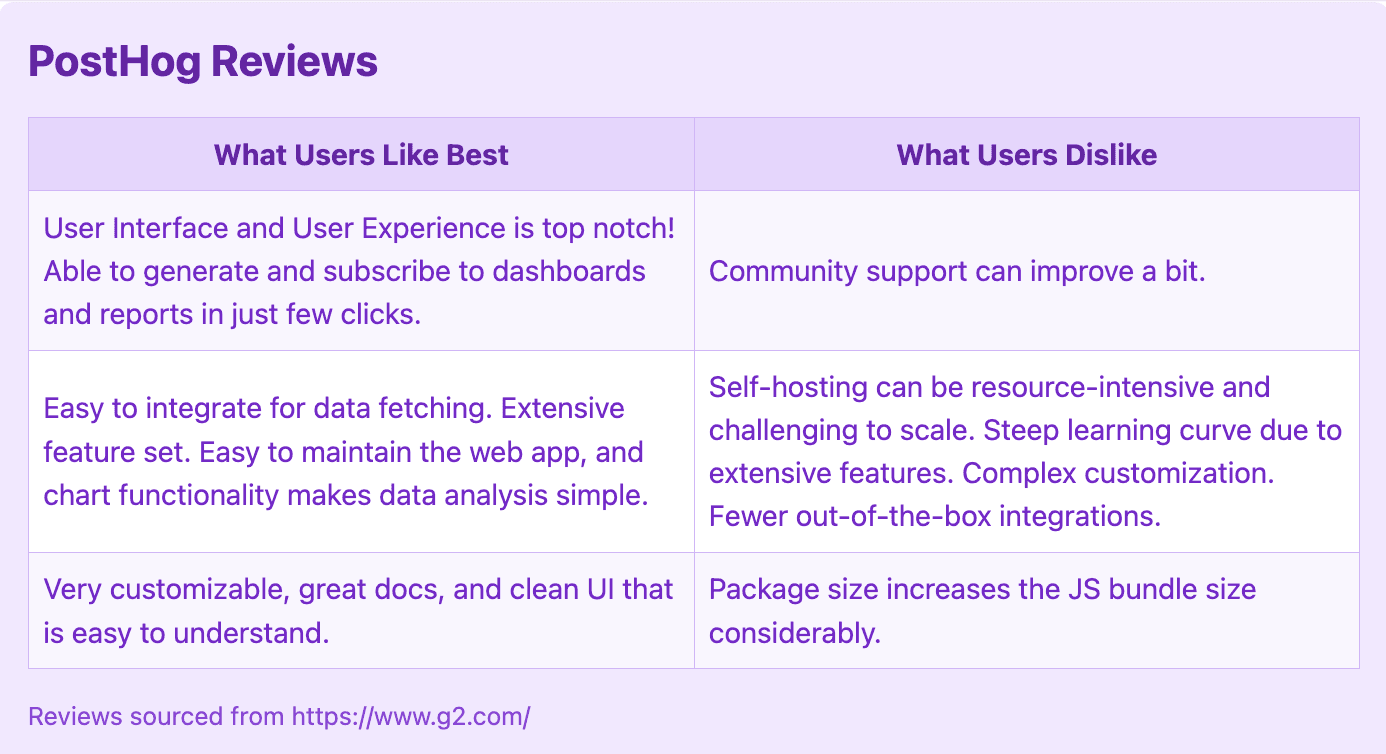
What do customers say?
Here's what customers are saying about PostHog, highlighting both its strengths and areas for improvement:
Conclusion
Selecting between Google Analytics and Posthog depends on your organization's specific needs, technical capabilities, and strategic focus. Google Analytics offers a comprehensive solution for organizations that prioritize marketing metrics and require seamless integration with advertising platforms. Its extensive feature set and powerful free tier make it an attractive option for businesses of all sizes.
Posthog, on the other hand, caters more specifically to product-focused teams that require deep insights into user behavior and product usage. Its open-source nature, self-hosting options, and built-in experimentation tools make it particularly appealing to organizations that value data privacy and require flexible, customizable analytics solutions.
Many organizations find value in utilizing both platforms, leveraging Google Analytics for its marketing insights and broad data collection capabilities, while using Posthog for more granular product analytics and experimentation. Ultimately, the choice should align with your team's expertise, your product's lifecycle stage, and your long-term data strategy.
As the product analytics landscape continues to evolve, it's crucial to regularly reassess your tooling choices to ensure they meet your organization's growing needs and adapt to changing privacy regulations and technological advancements.