

Exploring Mixpanel Alternatives for Robust Analytics

by
Wiktoria Slowikowska
Oct 17, 2024
Identify and convert your most valuable users

Sign Up
Choosing the right analytics tool can make all the difference in understanding user behavior, optimizing products, and driving growth. With many options available, each offering unique features and capabilities, it's crucial to understand how these tools compare and which might be the best fit for your specific needs.
This article aims to provide a thorough comparison of some of the most popular analytics tools in the market:
We'll explore the key features, strengths, and limitations of each tool, examining how they stack up in various aspects such as ease of use, depth of analytics, visualization capabilities, and pricing models. Whether you're a startup looking for your first analytics solution, or an enterprise considering a switch, this comparison will help you navigate the complex landscape of analytics tools.
By the end of this article, you'll have a clearer understanding of what each tool brings to the table and how they differ from one another. This knowledge will empower you to make an informed decision about which analytics solution aligns best with your organization's goals and requirements.
Let's dive in and unravel the unique offerings of each of these powerful analytics platforms.
Hotjar
Hotjar is a behavior analytics tool that helps you understand how users interact with your website or app. Unlike traditional analytics tools that primarily focus on numerical data, Hotjar provides visual representations of user behavior, making it easier for teams to grasp complex user interactions at a glance.
Key Features
Hotjar's feature set is designed to give you a comprehensive view of user behavior through both quantitative and qualitative lenses:
Heatmaps: At the heart of Hotjar's offering are its heatmaps. These visual representations show where users click, move, and scroll on your pages. It's like having a thermal camera for your website, highlighting the "hot" areas that get the most attention. This feature is particularly valuable for UX designers and marketers looking to optimize page layouts and call-to-action placements.
Session Recordings: Imagine being able to look over your users' shoulders as they navigate your site. That's essentially what Hotjar's session recordings offer. These recordings capture mouse movements, clicks, taps, and scrolling across multiple pages. It's an invaluable tool for identifying usability issues and understanding user journeys in granular detail.
Conversion Funnels: While not as advanced as some dedicated analytics tools, Hotjar's funnel feature allows you to visualize where users drop off in your conversion process. This is crucial for e-commerce sites or any business with a multi-step conversion process.
Form Analytics: Forms are often a critical part of user interaction, whether it's a signup process or a checkout page. Hotjar's form analytics show you where users hesitate, which fields cause confusion, and where they abandon the process. This granular insight can be the key to improving conversion rates significantly.
Feedback Polls and Surveys: Hotjar doesn't just show you what users do; it helps you understand why they do it. With on-site polls and surveys, you can gather qualitative feedback directly from your users. This feature bridges the gap between quantitative data and user sentiment, providing context to the behaviors you observe.
Incoming Feedback: This feature allows users to leave feedback on specific elements of your site. It's like having a suggestion box for every part of your website, giving users a voice and providing you with targeted, contextual feedback.
Pros: Where Hotjar Shines
Visual Intuitiveness: Hotjar's greatest strength is its ability to make data visual and intuitive. In a world where data can often be overwhelming, Hotjar's heatmaps and session recordings make it easy for anyone on the team to understand user behavior, regardless of their technical background.
Quick Insights: With Hotjar, you can often spot issues or opportunities quickly. A glance at a heatmap can reveal if users are missing an important call-to-action, or a session recording can show where users get stuck in your navigation.
Combining Quantitative and Qualitative Data: By offering both behavioral data (through heatmaps and recordings) and user feedback (through polls and surveys), Hotjar provides a more holistic view of the user experience than many of its competitors.
Ease of Setup: Compared to more complex analytics tools, Hotjar is relatively straightforward to set up and start using. This makes it accessible to small teams or businesses without dedicated analytics experts.
Privacy Compliance: In an era of increasing privacy concerns, Hotjar has built-in features to help with GDPR compliance, including data suppression tools and automatic user information redaction.
Cons: Where Hotjar Falls Short
Limited Advanced Analytics: While Hotjar excels at visualizing behavior, it lacks some of the more advanced analytics features found in tools like Mixpanel or Google Analytics. It's not the tool for deep statistical analysis or complex segmentation.
Sampling on High-Traffic Sites: For websites with high traffic, Hotjar uses sampling to manage data collection. While this helps with performance, it means you might not be seeing data from every single user.
Potential Performance Impact: If not implemented carefully, Hotjar's script can potentially slow down your website, especially on mobile devices or slower connections.
Limited Mobile App Support: While Hotjar works well for mobile websites, its support for native mobile apps is limited compared to its web capabilities.
Learning Curve for Advanced Features: While basic features are intuitive, getting the most out of Hotjar's more advanced capabilities can require a learning curve.
Pricing
Hotjar offers a tiered pricing model:
Basic Plan: Free for up to 35,000 pageviews per month. This plan includes basic heatmaps, recordings, and incoming feedback tools.
Plus Plan: Starting at $39 per month, this plan increases limits and adds features like form analytics and user attributes.
Business Plan: Starting at $99 per month, this plan is for larger sites and includes advanced features like API access and team collaboration tools.
Scale Plan: Custom pricing for enterprise-level needs.
The pricing structure makes Hotjar accessible to businesses of all sizes, from small startups to large enterprises.
Who is Hotjar Best For?
Hotjar is an excellent choice for several types of users and organizations:
UX Designers and Researchers: The visual nature of Hotjar's data makes it invaluable for UX professionals. Heatmaps and session recordings can quickly reveal usability issues and inform design decisions.
Marketing Teams: For marketers focused on conversion rate optimization, Hotjar provides the insights needed to understand user behavior and improve marketing effectiveness. It's particularly useful for optimizing landing pages and understanding campaign performance beyond just numbers.
E-commerce Businesses: Online retailers can benefit greatly from Hotjar's ability to visualize the customer journey. From understanding how users interact with product pages to identifying drop-off points in the checkout process, Hotjar can be a powerful tool for increasing sales.
Small to Medium-Sized Businesses: The ease of use and affordable pricing make Hotjar an attractive option for smaller businesses that may not have the resources for more complex analytics setups.
Content-Heavy Websites: Publishers and content-focused sites can use Hotjar to understand how users engage with their content, informing content strategy and layout decisions.
Agile Development Teams: The quick insights provided by Hotjar can be invaluable for teams working in rapid development cycles, allowing for fast iteration based on user behavior.
While Hotjar may not be a direct replacement for more comprehensive analytics tools like Mixpanel, it offers a unique, visual approach to understanding user behavior. Its strength lies in making user behavior data accessible and actionable for a wide range of team members. For organizations looking to complement their existing analytics with intuitive, visual insights, or for those prioritizing user experience optimization, Hotjar can be an invaluable addition to the analytics toolkit.
2. Amplitude
Amplitude is a powerful product analytics platform that helps businesses understand user behavior, optimize product experiences, and drive growth. It goes beyond traditional web analytics by focusing on user-centric insights and advanced behavioral analysis.
Key Features
Amplitude's feature set is designed to provide deep, actionable insights into user behavior and product performance:
Behavioral Cohorting: At the core of Amplitude's offering is its ability to create and analyze user segments based on their actions. This feature allows you to group users who have performed specific sequences of events, helping you understand the behaviors that lead to desired outcomes like conversion or retention.
Predictive Analytics: Amplitude leverages machine learning to forecast user behaviors and outcomes. This feature can help you identify users who are likely to churn, convert, or perform other key actions, allowing for proactive engagement and optimization.
Funnel Analysis: Amplitude's funnel analysis is highly flexible and powerful. It allows you to track conversion across multiple steps, compare funnels across different user segments, and analyze how changes in your product impact conversion rates over time.
Retention Analysis: Understanding user engagement over time is crucial for product success. Amplitude's retention analysis helps you visualize how well you're retaining users and which features or behaviors contribute to long-term retention.
Pathfinder: This feature visualizes the most common paths users take through your product. It's invaluable for understanding user journeys, identifying drop-off points, and optimizing the flow of your product.
Experiment: Amplitude includes a robust A/B testing and experimentation platform. This allows you to test hypotheses about user behavior and measure the impact of product changes with statistical rigor.
Behavioral Targeting: Leverage your analytics data to create targeted campaigns. This feature allows you to export behavioral cohorts to various marketing and communication tools for personalized engagement.
Pros: Where Amplitude Shines
Deep User Insights: Amplitude excels at providing granular insights into user behavior. Its ability to track and analyze complex user journeys across multiple touchpoints is particularly valuable for product-led companies.
Powerful Query Capabilities: For teams that need flexibility in their analysis, Amplitude's query interface allows for complex, custom analyses that go beyond pre-built reports.
Cross-Platform Tracking: Amplitude handles cross-platform user identification well, allowing you to track user behavior seamlessly across web, mobile, and other platforms.
Machine Learning Integration: The platform's predictive analytics and automated insights leverage machine learning to uncover patterns and predictions that might be missed by human analysis.
Scalability: Amplitude is designed to handle large volumes of data, making it suitable for businesses of all sizes, from startups to enterprises.
Cons: Where Amplitude Falls Short
Learning Curve: The depth and breadth of Amplitude's features can be overwhelming for new users. It may take time for teams to fully leverage all of its capabilities.
Cost: Amplitude can be more expensive than some of its competitors, especially for smaller businesses or those with high data volumes.
Overkill for Simple Needs: For businesses with basic analytics needs, Amplitude's advanced features might be unnecessary and could overcomplicate their analytics process.
Data Governance Complexity: With its powerful data collection capabilities, proper data governance and management in Amplitude can become complex, requiring dedicated resources.
Limited Visual Customization: While Amplitude provides a wide range of analysis options, some users find the options for visual customization of reports and dashboards to be limited compared to other BI tools.
Pricing
Amplitude offers a tiered pricing model:
Growth Plan: Free for up to 10 million actions per month.
Enterprise Plan: Custom pricing based on data volume and feature needs.
Amplitude One: A comprehensive bundle of Amplitude's products, with custom pricing.
Who is Amplitude Best For?
Amplitude is an excellent choice for several types of users and organizations:
Product Managers: Amplitude's focus on product analytics makes it an invaluable tool for product managers looking to make data-driven decisions about feature development and product strategy.
Data Analysts: The platform's powerful querying capabilities and flexibility make it a favorite among data analysts who need to perform complex analyses.
Growth Teams: For teams focused on user acquisition, activation, and retention, Amplitude provides the insights needed to optimize the entire user lifecycle.
Large Enterprises: The scalability and advanced features of Amplitude make it well-suited for large organizations with complex products and high data volumes.
SaaS and Mobile App Companies: Businesses with digital products, especially those with a focus on user engagement and retention, can benefit greatly from Amplitude's behavioral analysis capabilities.
E-commerce Businesses: Online retailers can use Amplitude to understand the customer journey, optimize conversion funnels, and personalize the shopping experience.
Amplitude is a robust product analytics platform that provides deep, actionable insights into user behavior. While it may have a steeper learning curve and higher cost compared to some alternatives, its powerful features and scalability make it an excellent choice for businesses that are serious about data-driven product development and growth. For organizations that need to understand complex user journeys, perform advanced cohort analysis, and leverage machine learning for predictive insights, Amplitude can be a game-changing addition to their analytics toolkit.
3. PostHog
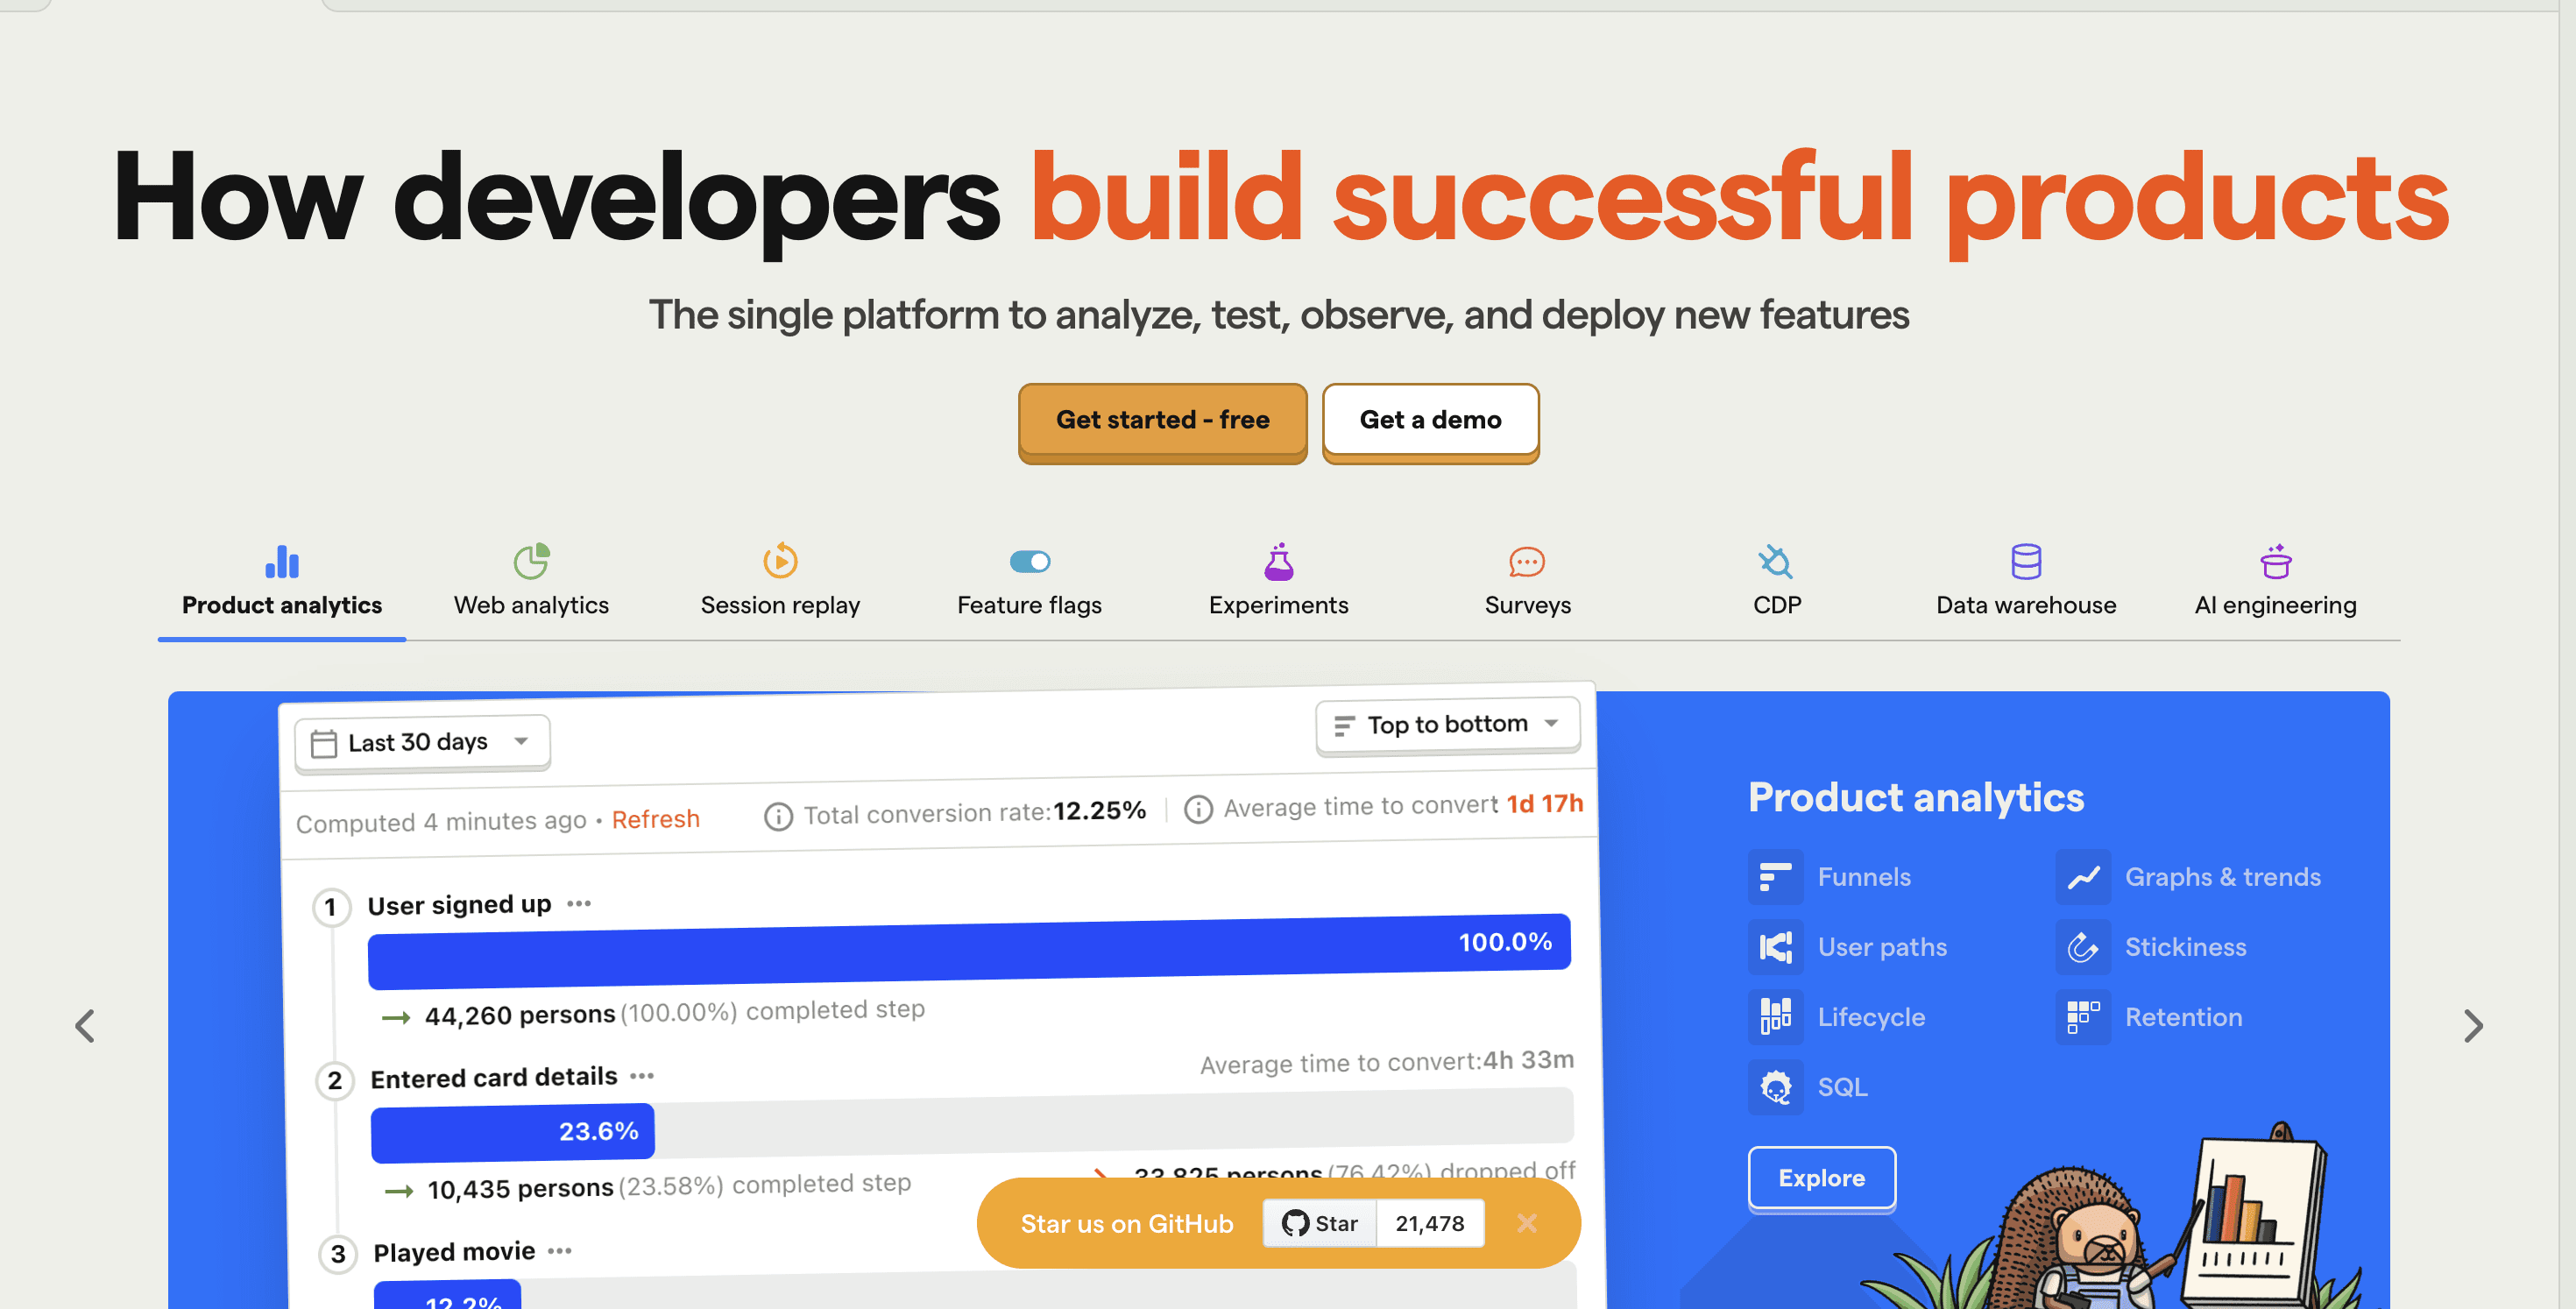
PostHog is an open-source product analytics platform that offers a unique combination of analytics, feature flagging, and experimentation tools. It stands out for its self-hosting option and privacy-focused approach.
Key Features
PostHog offers a comprehensive suite of tools for product analytics and experimentation:
Event Tracking: PostHog allows you to track user interactions and events across your product. You can define custom events and properties to capture the data that's most relevant to your business.
Session Recording: This feature captures user sessions, allowing you to watch how users interact with your product. It's invaluable for understanding user behavior and identifying usability issues.
Feature Flags: PostHog includes robust feature flagging capabilities, allowing you to roll out new features gradually, conduct A/B tests, or toggle features for specific user segments.
Funnel Analysis: Visualize and analyze your conversion funnels to identify where users drop off and optimize your user journey.
Cohort Analysis: Group users based on their behaviors or properties and analyze how different cohorts interact with your product over time.
Heatmaps: Visualize where users click, move, and scroll on your pages to understand engagement patterns.
Experimentation: Run A/B tests to measure the impact of product changes on user behavior and key metrics.
User Paths: Analyze the common paths users take through your product to optimize the user journey.
Pros: Where PostHog Shines
Open Source: As an open-source platform, PostHog offers transparency, customizability, and the ability to self-host, which is crucial for companies with strict data privacy requirements.
All-in-One Platform: PostHog combines analytics, session recording, feature flagging, and experimentation in one platform, reducing the need for multiple tools.
Privacy-Focused: With options for self-hosting and EU hosting, PostHog is well-suited for companies with stringent data privacy needs.
Developer-Friendly: PostHog offers strong API support and integrations, making it a favorite among development teams.
Community Support: Being open-source, PostHog benefits from community contributions and regular updates.
Cons: Where PostHog Falls Short
Learning Curve: The breadth of features can be overwhelming for new users, especially those without technical backgrounds.
Self-Hosting Complexity: While self-hosting offers benefits, it also requires technical expertise to set up and maintain.
Less Mature than Some Competitors: As a relatively newer platform, PostHog may lack some advanced features found in more established competitors.
Limited Advanced Analytics: While PostHog offers a wide range of features, it may not have the depth of advanced analytics capabilities found in specialized tools.
Resource Intensive: Self-hosted installations can be resource-intensive, potentially requiring significant server capacity for high-traffic applications.
Pricing
PostHog offers a flexible pricing model:
Open Source: Free, self-hosted version with unlimited events.
Cloud: Starts at $0/month for up to 1 million events, with tiered pricing for higher volumes.
Enterprise: Custom pricing for large-scale deployments and additional support.
Who is PostHog Best For?
PostHog is an excellent choice for several types of users and organizations:
Privacy-Conscious Companies: Organizations that need to keep their data on-premise or have strict data privacy requirements.
Startups and SMBs: The free self-hosted option and affordable cloud pricing make PostHog accessible for smaller companies.
Development Teams: PostHog's developer-friendly approach and feature flagging capabilities make it popular among engineering teams.
Open Source Enthusiasts: Companies that prefer open-source solutions for their transparency and customizability.
Product Managers: The combination of analytics and experimentation tools is valuable for data-driven product development.
SaaS Companies: The feature flagging and experimentation tools are particularly useful for SaaS products that are constantly evolving.
PostHog offers a unique proposition in the product analytics space with its open-source nature and all-in-one platform approach. While it may require more technical expertise to set up and use effectively, it provides a powerful and flexible solution for companies that value data privacy and want a high degree of control over their analytics infrastructure. Its combination of analytics, feature flagging, and experimentation tools makes it a compelling choice for product-led companies looking to make data-driven decisions and iterate quickly on their products.
4. Google Analytics 4 (GA4)
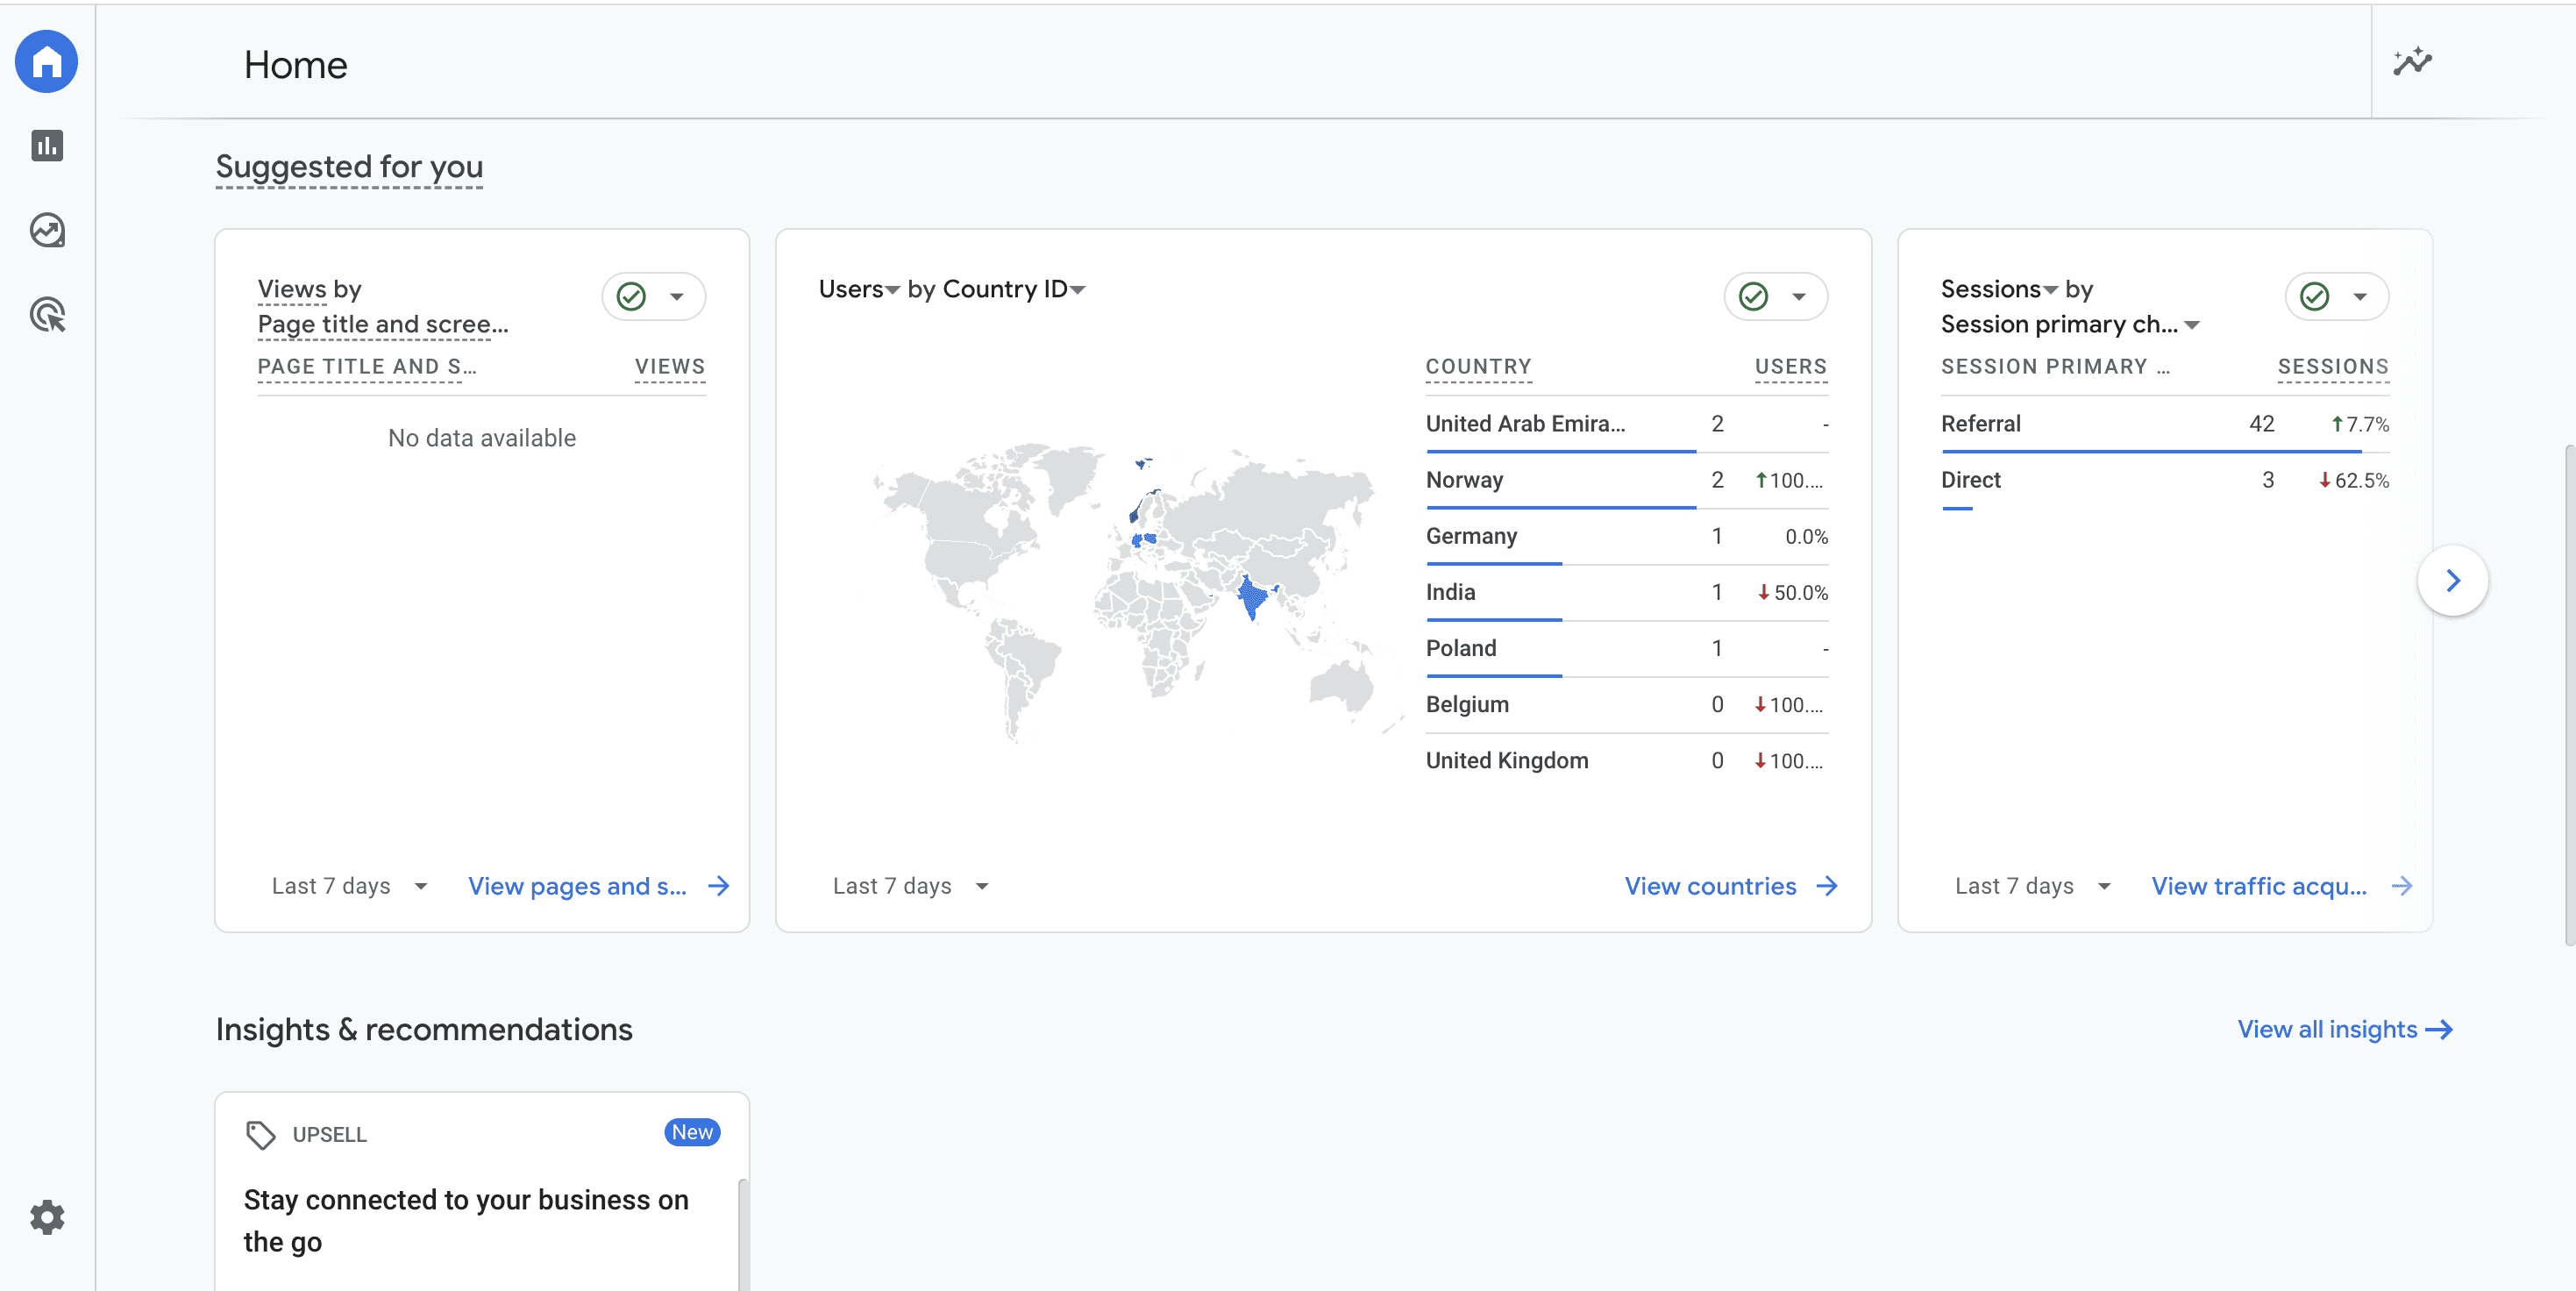
Google Analytics 4 is the latest iteration of Google's web analytics platform. It represents a significant shift from previous versions, focusing on event-based data models and providing a more unified approach to tracking both web and app data.
Key Features
GA4 offers a range of features designed to provide comprehensive insights into user behavior across platforms:
Event-Based Measurement: GA4 uses a flexible event-based data model, allowing for more customized and detailed tracking of user interactions.
Cross-Platform Tracking: GA4 can track user journeys across websites and apps, providing a more holistic view of user behavior.
AI-Powered Insights and Predictions: Leveraging machine learning, GA4 can automatically surface insights and make predictions about user behavior and conversion likelihood.
Enhanced Measurement: Automatically track events like scrolls, outbound clicks, file downloads, and video engagement without additional coding.
Funnel Analysis: Create and analyze conversion funnels to understand where users drop off in their journey.
User Lifetime Reporting: Gain insights into the entire user lifecycle, from acquisition to conversion and retention.
BigQuery Export: Free BigQuery export for all GA4 properties, allowing for more advanced data analysis and integration with other data sources.
Data-Driven Attribution: Uses machine learning to determine how much credit to assign to each marketing touchpoint in the customer journey.
Pros: Where GA4 Shines
Free for Most Users: GA4 offers robust analytics capabilities at no cost for most businesses, making it highly accessible.
Integration with Google Ecosystem: Seamless integration with other Google tools like Google Ads, Search Console, and Data Studio.
Machine Learning Capabilities: Built-in AI and machine learning features provide automated insights and predictions.
Privacy-Centric Design: GA4 is designed with privacy in mind, with features like cookieless measurement and more granular data controls.
Scalability: Can handle large volumes of data, making it suitable for businesses of all sizes.
Cons: Where GA4 Falls Short
Learning Curve: The shift from Universal Analytics to GA4 involves significant changes, requiring users to learn new concepts and interfaces.
Limited Historical Data: GA4 doesn't migrate historical data from Universal Analytics, which can be a challenge for long-term trend analysis.
Less Granular Data: Some users find that GA4 provides less granular data compared to Universal Analytics in certain areas.
Still Evolving: As a relatively new platform, GA4 is still adding features and refining its interface, which can lead to frequent changes.
Complex Setup for Advanced Features: While basic setup is straightforward, configuring advanced features and custom events can be complex for non-technical users.
Pricing
Google Analytics 4 offers a simple pricing model:
Free Version: Available for most users with no limitations on data volume.
GA4 360: Enterprise version with additional features, support, and SLAs. Pricing is custom and typically starts around $150,000 per year.
Who is Google Analytics 4 Best For?
GA4 is well-suited for a wide range of users and organizations:
Small to Medium-Sized Businesses: The free version offers robust analytics capabilities suitable for most SMBs.
Large Enterprises: The GA4 360 version provides advanced features and support for enterprise-level needs.
Marketing Teams: Strong integration with Google Ads and other marketing tools makes it valuable for marketing analytics.
E-commerce Businesses: Enhanced e-commerce tracking and reporting capabilities are beneficial for online retailers.
Mobile App Developers: Improved app tracking capabilities make GA4 a strong choice for mobile app analytics.
Multi-Platform Businesses: The ability to track user journeys across web and app platforms is valuable for businesses with both web and mobile presence.
Google Analytics 4 represents a significant evolution in web and app analytics. Its event-based model, cross-platform tracking, and AI-powered insights provide a powerful toolset for understanding user behavior. While the transition from Universal Analytics may present a learning curve, GA4's privacy-centric design and integration with the Google ecosystem make it a compelling choice for businesses of all sizes. Its free tier offers substantial value, making advanced analytics accessible to a wide range of organizations. However, users should be prepared for ongoing changes and updates as the platform continues to evolve.
5. Hyperaktiv.ai
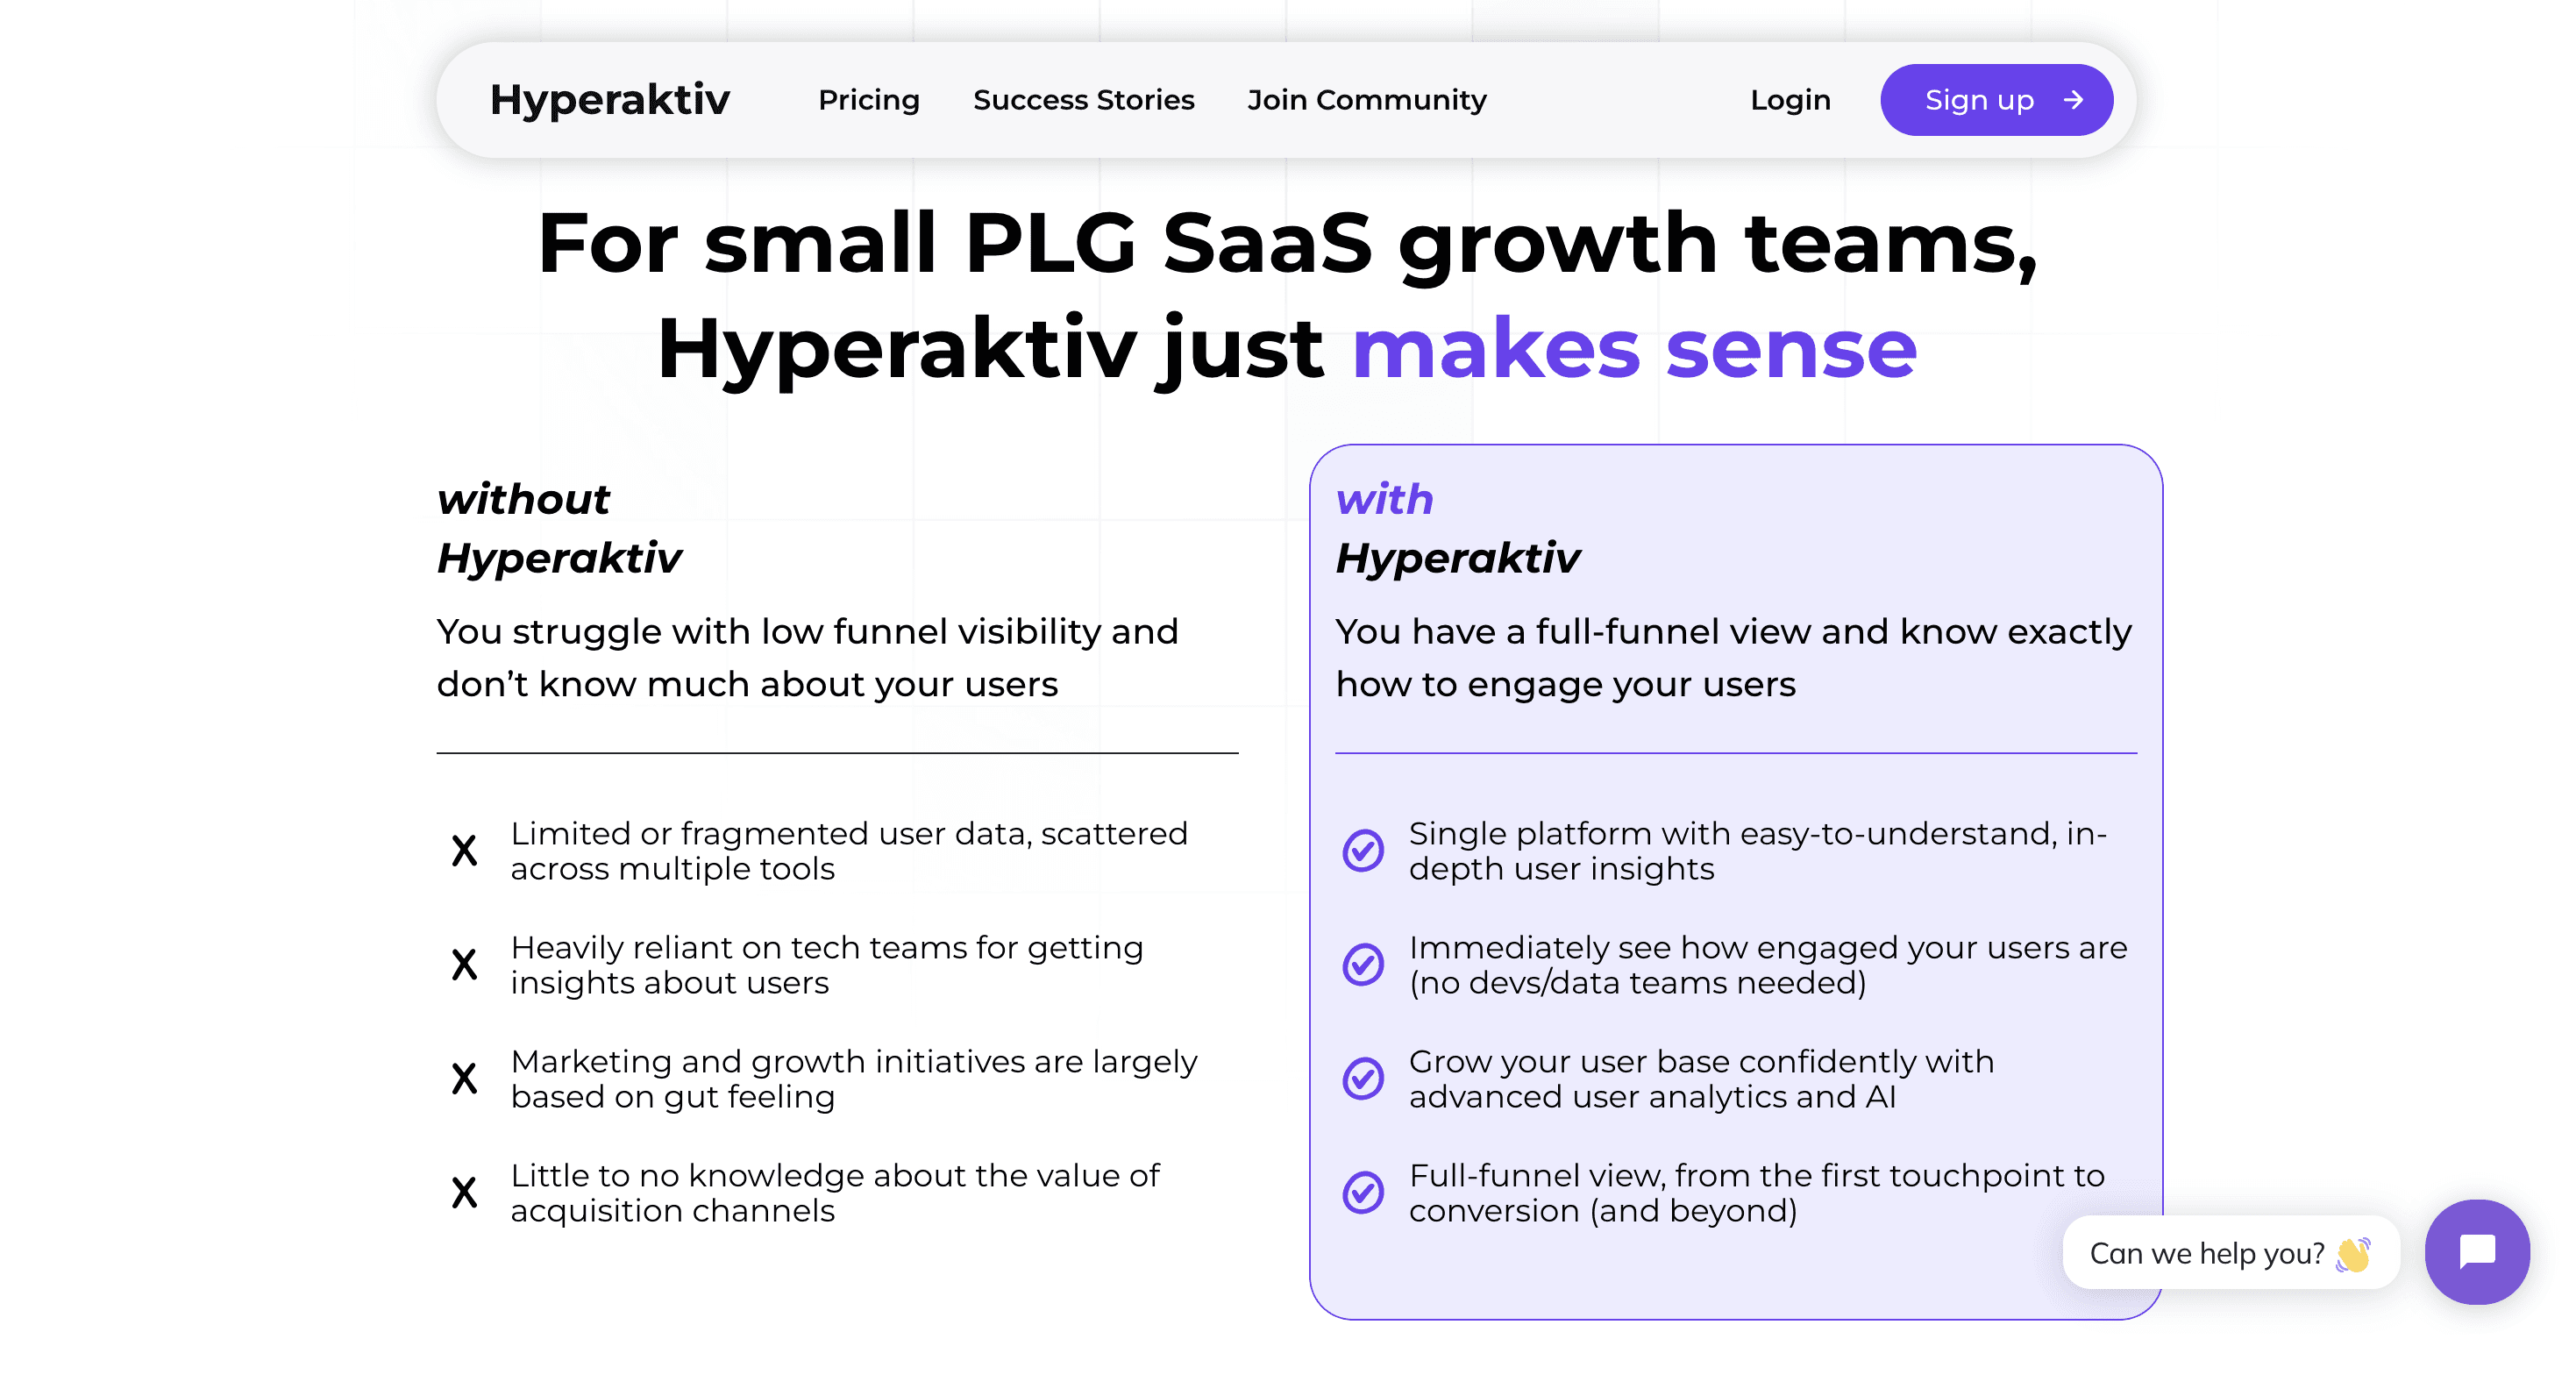
Hyperaktiv.ai is a focused analytics and engagement platform designed specifically for small to medium-sized SaaS companies. It emphasizes quick insights and actionable recommendations to drive user engagement and conversion, with a particular focus on product-led growth (PLG) strategies.
Key Features
Hyperaktiv.ai offers a range of features tailored to the needs of SaaS businesses:
User Segmentation:
Automates segmentation by lifecycle stage: Automatically sorts users into different stages of their journey, such as new users, active users, or churned users. This saves time by eliminating manual classification.
Classifies users by engagement level: Tracks user activity and interaction, allowing the system to categorize them as highly engaged, moderately engaged, or inactive. This helps tailor marketing or engagement efforts based on the user’s activity level.
Matches users to Ideal Customer Profiles (ICP): Compares user behavior and demographics to predefined ICPs, making it easier to focus efforts on high-potential leads that align with your target market.
User Profiling:
Enriches user data for comprehensive insights: Combines external data sources and internal user data to create more detailed profiles, giving deeper insights into customer preferences, behaviors, and needs.
Tracks engagement metrics for deeper understanding: Continuously monitors user actions, such as logins, page views, or feature usage, enabling businesses to see how deeply users interact with the platform and identify areas of improvement.
Lifecycle Analysis:
Maps detailed timelines of user progression: Visualizes the entire user journey, from first interaction to subscription and beyond, making it easier to identify bottlenecks or points where users are most likely to convert or churn.
Measures time-to-conversion for optimizing user journeys: Tracks the amount of time it takes for users to move from one stage to another (e.g., from free trial to paying customer), providing insights into which parts of the funnel may need optimization.
4. Retention Analysis:
Identifies at-risk users for proactive engagement: Uses behavioral data to detect users likely to churn based on decreasing activity or other warning signs. This helps SaaS businesses proactively reach out with tailored messaging or offers to re-engage those users.
Generates comprehensive engagement timelines for user retention strategies: Shows a detailed view of how users have engaged over time, enabling businesses to develop strategies that can improve retention, such as personalized outreach or targeted incentives.
5. Acquisition Channel Evaluation:
Rates marketing channels using a sophisticated system for optimized resource allocation: Analyzes the effectiveness of various marketing channels (e.g., social media, email, paid ads) and assigns scores based on their ability to acquire high-quality users. This enables better decisions on where to invest marketing resources for maximum ROI.
6. Actionable Insights:
Focuses recommendations on immediately applicable, practical actions: Provides clear, actionable steps instead of generic advice, ensuring that suggestions are easy to implement for improving user engagement, conversion, or retention.
Prioritizes high-impact actions for maximum efficiency: Highlights the most important actions that can deliver the biggest results, helping businesses prioritize their efforts and resources effectively.
7. Rapid Implementation:
Streamlines setup process for quick deployment (less than 10 minutes): The system is designed to be installed and operational within minutes, minimizing downtime and making it ideal for businesses that want fast results.
Minimizes configuration needs for ease of use: Reduces the complexity of setting up workflows and segmentations, enabling non-technical users to get started without the need for extensive customization.
8. Hyperpersonalization:
Tailors messaging to individual users for enhanced engagement: Sends personalized emails, push notifications, or in-app messages that are specifically tailored to each user's behavior, preferences, or lifecycle stage, driving better engagement.
Supports multiple languages for global reach: Enables businesses to send personalized messages in various languages, making it easier to connect with users around the world in their native language.
Adapts messaging based on user characteristics for improved relevance: Customizes communications by dynamically changing messaging based on real-time user data (e.g., location, past behavior), ensuring messages feel relevant and timely.
Actionable Funnel Recommendations:
Provides specific, actionable tips for each stage of the user funnel: Gives tailored recommendations for improving conversion rates at every stage, from awareness to acquisition, activation.
Offers targeted suggestions for activating users: Suggests concrete strategies, like sending personalized reminders or offering free trials, to move users who haven’t yet engaged to start interacting with the platform.
Addresses specific challenges in user acquisition, activation, retention, and conversion: Focuses on the most critical pain points in the SaaS user journey and offers practical solutions to improve performance at each stage.
Pros: Where Hyperaktiv.ai Shines
Rapid Implementation: User-friendly interface and quick setup process, providing fast time-to-value.
Actionable Insights: Focuses on delivering practical recommendations that businesses can implement quickly.
Comprehensive User Journey Tracking: Provides detailed lifecycle analysis from first visit to conversion.
Sophisticated Acquisition Channel Evaluation: Aids in optimizing marketing efforts and spend.
Automated Segmentation and Profiling: Saves time on manual data analysis with automatic user categorization.
Cons: Where Hyperaktiv.ai Falls Short
Limited Chart-Building Capabilities: May not suit businesses needing extensive custom analytics.
Narrow Industry Focus: Primarily designed for SaaS businesses, potentially less suitable for other business models.
Limited Advanced Features: May lack some capabilities found in more comprehensive marketing automation platforms.
Pricing
Hyperaktiv.ai offers a transparent pricing model with two tiers:
Free Tier: €0/month
Supports up to 1,000 monthly active users
Starter Tier: Starting from €49/month
Supports up to 5,000 monthly active users
Who is Hyperaktiv.ai Best For?
Hyperaktiv.ai is an excellent choice for several types of users and organizations:
Small to Medium-Sized SaaS Companies: Specifically designed for this market segment.
Product-Led Growth (PLG) Focused Teams: Ideal for businesses emphasizing user behavior and engagement to drive growth.
Startups and Growing SaaS Businesses: The free tier and affordable pricing make it accessible for companies in early growth stages.
Teams Seeking Quick Insights: Best for organizations that need to make data-driven decisions rapidly without extensive analysis.
SaaS Businesses Optimizing Onboarding: Particularly useful for companies looking to improve their user onboarding and retention processes.
Marketing Teams in SaaS Companies: The acquisition channel evaluation feature is valuable for optimizing marketing efforts.
Hyperaktiv.ai offers a specialized solution for SaaS companies focusing on product-led growth. Its strength lies in providing quick, actionable insights without the complexity of more comprehensive analytics tools. While it may not offer the depth of features found in some larger platforms, its focused approach, rapid implementation, and user-friendly interface make it an attractive option for small to medium-sized SaaS businesses looking to optimize their user engagement and conversion processes. The platform's emphasis on automating user segmentation and providing actionable recommendations aligns well with the needs of growing SaaS companies that need to make data-driven decisions quickly and efficiently.
6. Kissmetrics
Kissmetrics is a customer-centric analytics and engagement platform designed to help businesses understand, segment, and engage their customers. It focuses on tracking individual user behavior throughout the entire customer lifecycle, from first interaction to long-term retention.
Key Features
Kissmetrics offers a range of features aimed at providing deep customer insights and enabling targeted engagement:
Person-Based Analytics: Tracks individual user behavior across devices and over time, providing a comprehensive view of each customer's journey.
Customer Journey Mapping: Visualizes the path users take from first touch to conversion and beyond, helping identify key touchpoints and potential drop-off points.
Cohort Analysis: Groups users based on shared characteristics or behaviors, allowing businesses to compare how different segments perform over time.
A/B Testing: Enables testing of different variations of web pages, emails, or other touchpoints to optimize conversion rates.
Funnel Analysis: Tracks user progression through defined conversion funnels, highlighting where users drop off in the process.
Revenue Analytics: Ties user behavior directly to revenue, helping businesses understand the monetary impact of different user segments and actions.
Automated Segmentation: Automatically groups users based on behavior, allowing for targeted marketing and product strategies.
Campaign Tracking: Measures the effectiveness of marketing campaigns across multiple channels, including email, social media, and ads.
Pros: Where Kissmetrics Shines
Customer-Centric Approach: Focuses on individual user journeys, providing deep insights into customer behavior.
Comprehensive Tracking: Follows users across devices and channels, offering a holistic view of the customer experience.
Strong Revenue Attribution: Directly ties user actions to revenue, helping businesses understand the financial impact of different behaviors and campaigns.
Actionable Insights: Provides not just data, but actionable recommendations to improve customer engagement and conversion.
Integration Capabilities: Offers integrations with a wide range of marketing and customer service tools, enhancing its utility within existing tech stacks.
Cons: Where Kissmetrics Falls Short
Learning Curve: The depth of features can be overwhelming for new users, requiring time to fully leverage the platform's capabilities.
Price Point: Can be expensive compared to some competitors, especially for smaller businesses or those with high traffic volumes.
Limited Free Trial: Offers a shorter free trial period compared to some alternatives, which may not be enough time for thorough evaluation.
Complex Setup: Initial configuration and event tracking setup can be complex, potentially requiring technical expertise.
Limited Ad-Hoc Analysis: While strong in predefined reports, some users find it less flexible for ad-hoc data exploration compared to some competitors.
Pricing
Kissmetrics offers a tiered pricing model:
Silver Plan: Starting at $299/month
Includes core analytics features
Gold Plan: Starting at $499/month
Adds advanced features like A/B testing and more integrations
Custom Plan: Pricing varies based on specific needs and data volume
Who is Kissmetrics Best For?
Kissmetrics is well-suited for several types of users and organizations:
E-commerce Businesses: The platform's focus on customer journeys and revenue attribution is particularly valuable for online retailers.
SaaS Companies: Features like cohort analysis and customer lifecycle tracking are crucial for subscription-based businesses.
Marketing Teams: The campaign tracking and A/B testing features make it a powerful tool for marketers focused on optimizing customer acquisition and engagement.
Customer Experience Professionals: The detailed user journey mapping helps in understanding and improving the overall customer experience.
Data-Driven Organizations: Businesses that base their strategies on customer data and behavioral insights will find Kissmetrics' comprehensive tracking valuable.
Mid-Size to Large Businesses: The pricing and feature set are more aligned with the needs and budgets of larger organizations.
Kissmetrics offers a robust solution for businesses looking to gain deep insights into their customers' behavior and optimize their marketing and product strategies accordingly. Its strength lies in its person-based analytics approach, providing a comprehensive view of each customer's journey across different touchpoints and devices. While it may require some investment in terms of both cost and learning curve, Kissmetrics can be a powerful tool for businesses serious about leveraging customer data to drive growth and improve retention. It's particularly well-suited for e-commerce and SaaS companies that need to understand complex customer journeys and tie user behavior directly to revenue outcomes