
Comparing The Best Data Tracking Software 2024

by
Francois Lecomte
Sep 16, 2024
Identify and convert your most valuable users

Sign Up
Every online business knows how critical it is to understand their users' profiles and intentions. The capabilities of interacting with them in real time are limited, which creates a huge challenge for acquisition and conversion. That's why tracking software is a must-have for all online businesses. But which tool should we use?
In this article, we will explore the best alternatives in 2024, regarding their features, but also which usage they relate to.
Why you need multiple tracking tools
It's rare to find a single tracking software that can fulfill all your needs. The reason? Your objectives are multifaceted. Depending on your role in the company, some tools might be a better fit.
Besides, tracking tools are typically limited to the data collected by their tracking code on web browsers or the data you explicitly send from your website or app. This often isn't enough to accurately assess if a user aligns with your Ideal Customer Profile (ICP).
Here is a review of the most common ones (there is no specific order).
Google Analytics
Probably one of the most popular tracking software, Google Analytics was released almost 20 years ago. Initially dedicated to website analysis, it's now possible to use it on mobile devices as well.
Main advantages:
Its main advantage is to be very easy to set up, as your dashboard is already created, and it requires only a couple of minutes to deploy the tracking code.
Provides most of the KPIs required for marketing purposes.
Main disadvantages:
You won't be able to get any metric related to a specific user; all metrics are globalized for the whole cohort, as the tool's intention is to give you high-level KPIs.
Focuses mostly on acquisition and visitor engagement on your website. What is called a "conversion" in Google Analytics must be understood from a pure marketing point of view: when the visitor creates an account, or gets in touch with you through a contact form. For B2B SaaS businesses, "conversions" in Google Analytics are not related to purchases, which makes it mostly dedicated to marketing.
Not suitable for product analytics.
Covers user acquisition mostly.
Core features:
Session tracking: it is possible to measure average sessions length, but not per user.
Session recording & replay: not available.
User details: no details available on a specific user.
Funnel analysis: very poor.
Revenue tracking: very poor, as it focuses on e-commerce and purchases made through mobile stores (Google Play and Apple Store).
Typical user: Marketing
Pricing: Free
Hotjar
10 years ago, Hotjar was probably the first tool to offer the possibility of recording and watching the replay of the user's activity. Hotjar focuses mostly on helping you improve the UX/UI of your website, but it can also be used on your web app.
Main advantages:
Perfect for UX debugging: heatmaps and session recordings.
Focused on user journey.
Main disadvantages:
No global KPIs.
Not meant to be used for time-based analysis.
Focuses only on retention, doesn't cover acquisition or conversion.
Limited freemium.
No user identification.
Core features:
Session tracking: accurate tracking and computation, but global metrics only: not possible to measure session metrics per user, not possible to follow all the journey of a specific user across several pages / domains.
Session recording & replay: this is the core feature of Hotjar, it works perfectly for UX/UI debugging; unfortunately not possible to get more information about each user.
Heatmaps: practical to get a quick overview of where the users point / click on our web pages.
Typical user: UX/UI designer
Pricing:
Freemium up to 35 recordings per day.
200€/month for 500 sessions per day.
Microsoft Clarity
Launched in 2020, Microsoft Clarity is intended to compete with Hotjar by focusing on user experience on websites, web apps and mobile apps. It also includes some global metrics like Google Analytics, so its positioning is quite at the intersection of Hotjar and Google Analytics.
Main advantages:
Very simple to use.
Provides just what you need to review your users' behavior.
Free.
Main disadvantages:
Limited compared to Hotjar.
Limited compared to Google Analytics.
Core features:
Session tracking: global metrics are available, but less detailed than Google Analytics; not possible to follow the whole journey of a specific user across multiple pages / domains.
Session replay: works well, very practical to debug what each user did on the website; but unfortunately not a lot of information about each user.
Heatmaps: works well, practical for website analysis.
Errors debugger: possibility to capture error messages that were displayed on the page.
Typical user: UX/UI designer
Pricing: Free
Mixpanel
Mixpanel is a proper analytics platform created in 2009, which means that the tool can handle a large amount of charts and analytical reports. Some charts are already available, although some time is required not only to understand how to use Mixpanel, but also to configure the reports for your specific needs.
Main advantages:
Possibility to create more or less any type of chart / report.
Completely agnostic when it comes to what you're actually tracking.
Different dashboards depending on your role (marketing, growth, product).
Can cover website & any kind of app.
Main disadvantages:
Complexity to set up and configure.
No automation / limited possibility to export data (images or pdf).
Revenue tracking: very poor.
Core features:
Reporting.
Session tracking.
Typical user: Product, marketing, tech
Pricing:
Free up to 20 million events per month (but no API).
Less than 100€/month beyond.
Amplitude
Amplitude is an analytics platform created in 2014 following the same logic as Mixpanel: it receives "events" from a website / app, and offers charts to give you a better understanding of your users' behavior. Just like Mixpanel, the configuration and the mastery of Amplitude require some time. The capabilities and the interface are more complex than Mixpanel, which is both interesting and sometimes annoying.
Main advantages:
You can create your own charts.
Provides reports and charts for any type of event, both on the website and the app.
Some dashboards are ready to be used.
Main disadvantages:
Time to set up and configure.
Not easy to get a simple answer to basic questions.
Some annoying bugs in the interface.
Not possible to browse events that were received in the past; not practical to debug the tracking infrastructure.
Main features:
Global KPIs through charts & reports.
Possibility to get user-related insights.
Session recordings: in the paid plan.
Revenue tracking: possibility to monitor how much your users pay (but the configuration is quite tricky).
Typical user: Product, marketing, tech
Pricing:
Free up to 50k tracked users per month.
~50€/month up to 300k monthly tracked users.
Posthog
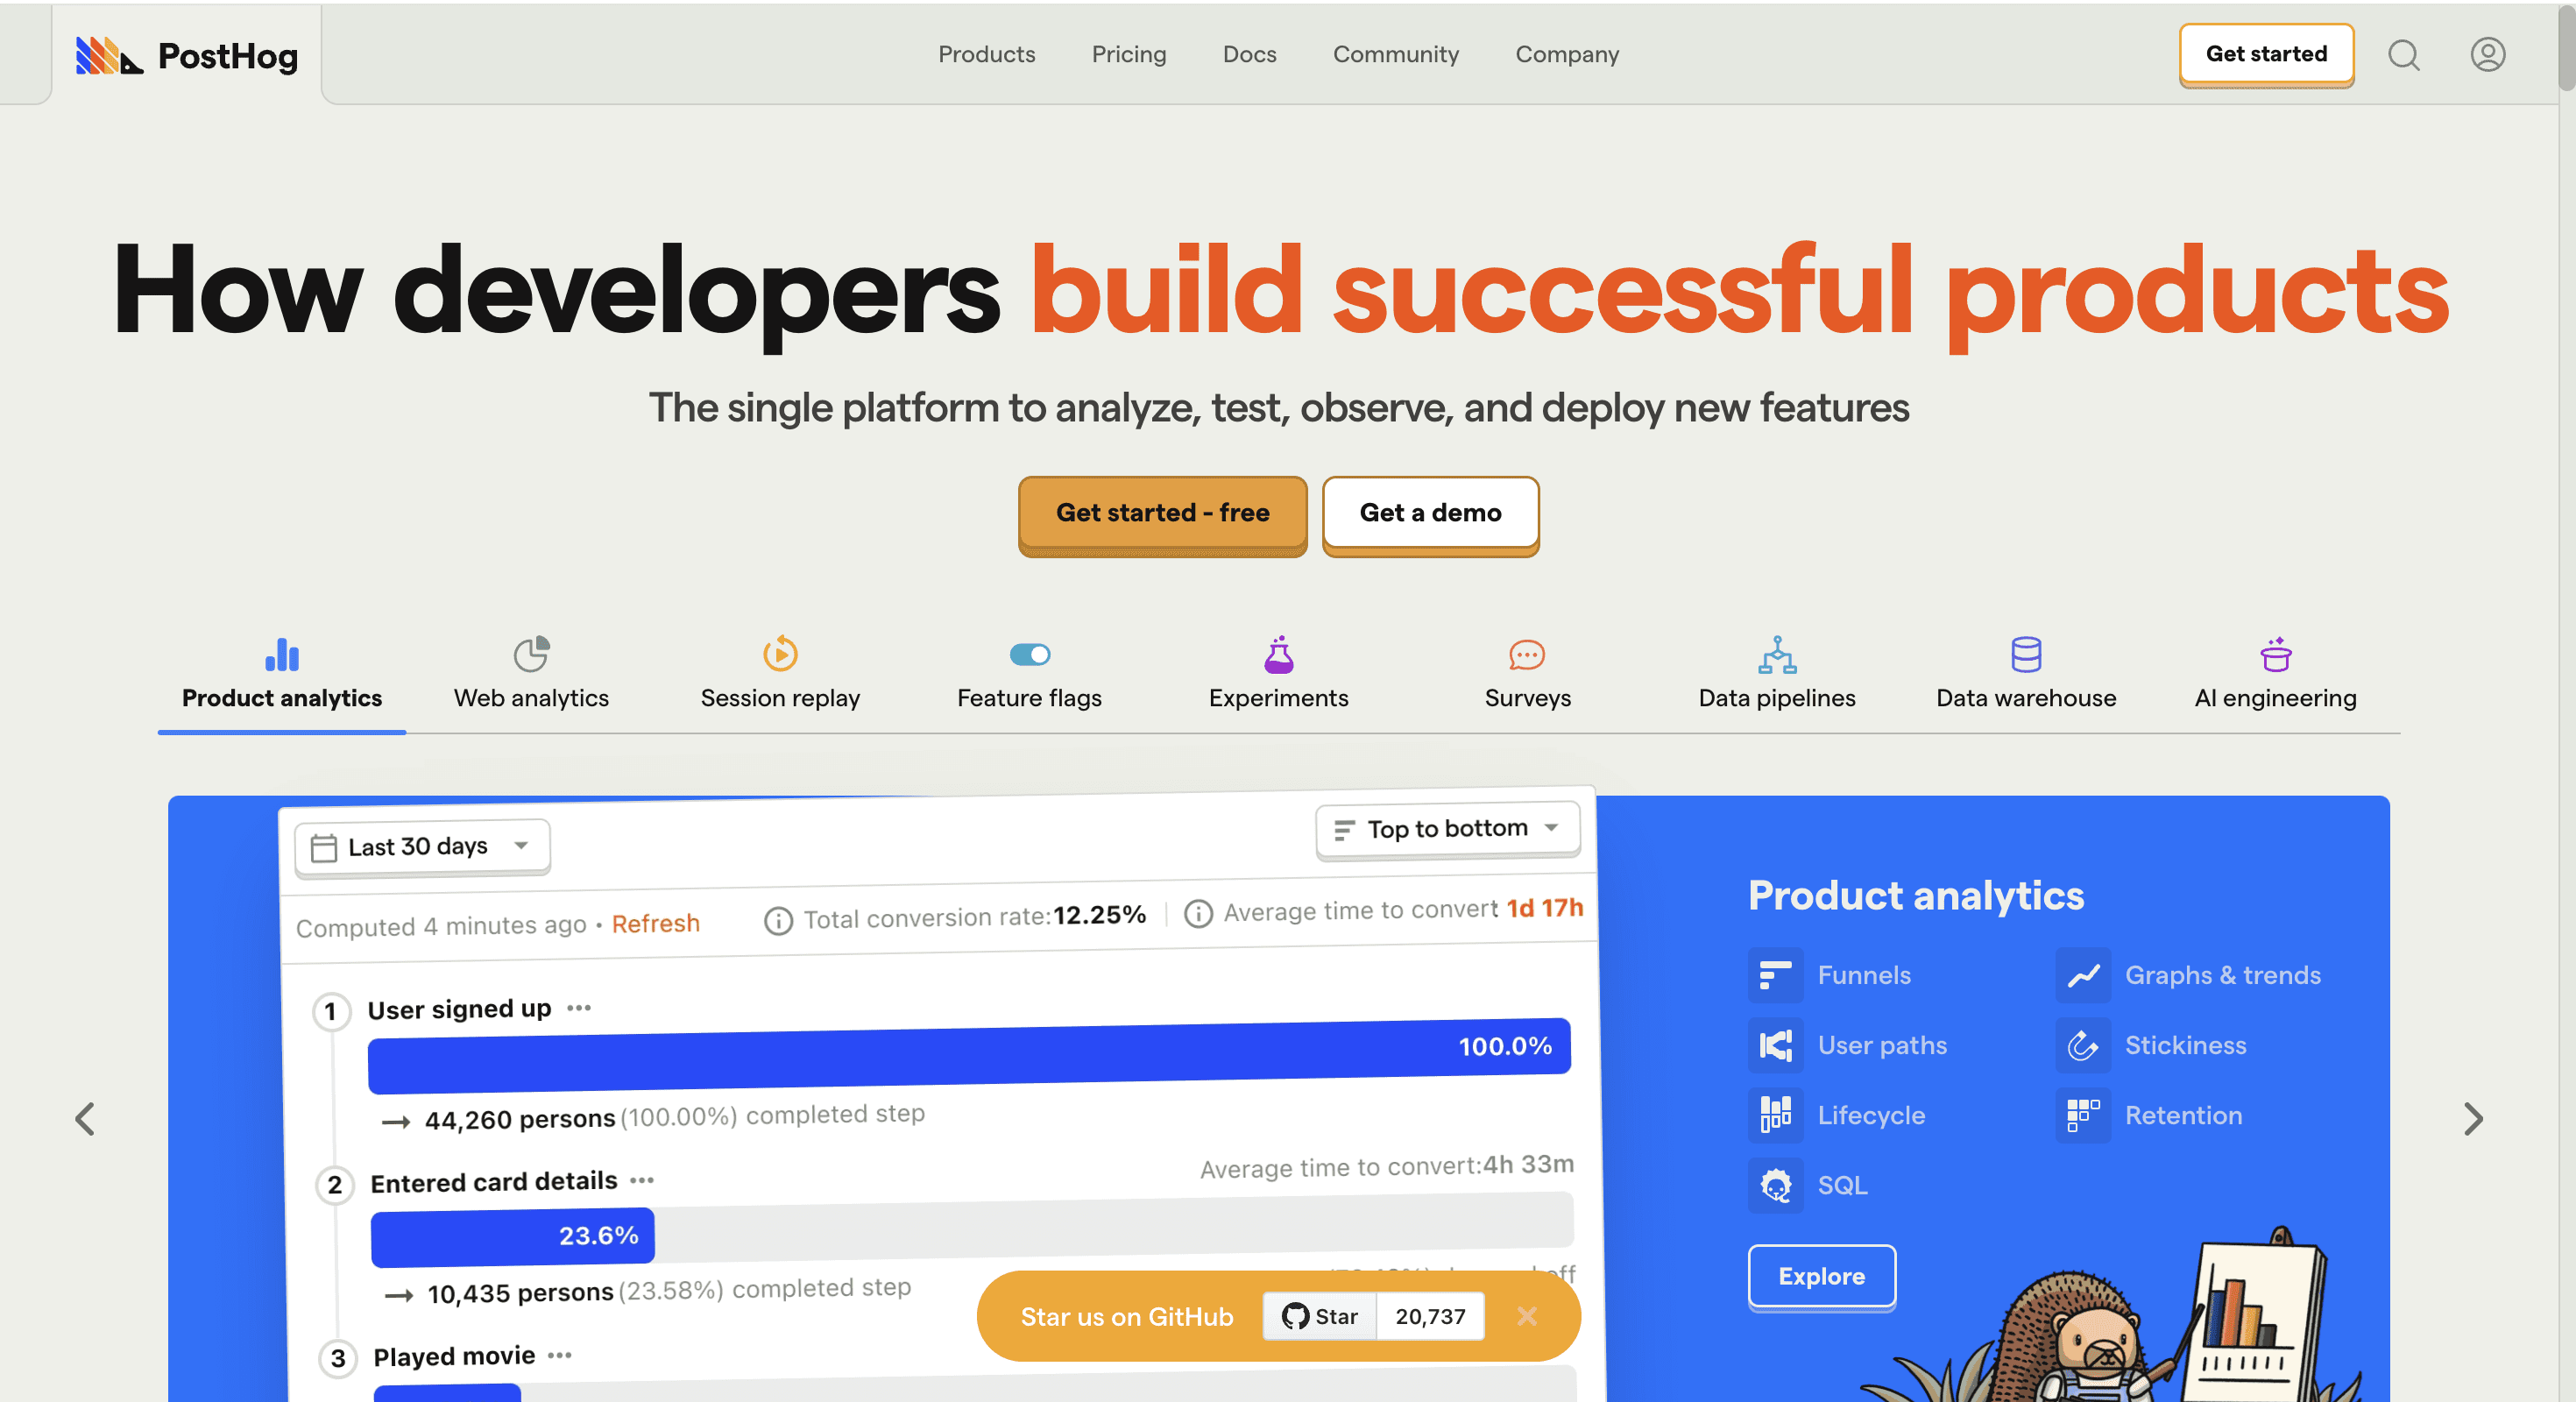
Posthog was created in 2020 to help developers manage their app's technical notifications. It grew into popularity amongst software developers as the platform offers the right tools for them, but it also includes more and more "understandable" charts and reports for non-tech savvy people.
Main advantages:
Access to data through queries on the data warehouse, perfect for software developers.
A good choice if it's about collecting events from both website and app.
Possibility to get both global and user-related insights.
Main disadvantages:
Way too complex for non tech-savvy people.
Several bugs on very important charts (wrong metrics on retention...) that decrease confidence in the tool.
Very limited capabilities when it comes to creating charts and reports.
Core features:
Analytics: Posthog offers analytics on most of the key metrics you need: session tracking, monthly/weekly/daily active users, retention...
Session replay: possibility to review the activity of each session, and it is linked to the user info.
Typical user: Tech
Pricing:
Free up to 1M events per month.
Then the price varies quite a lot depending on which features you want.
Hyperaktiv
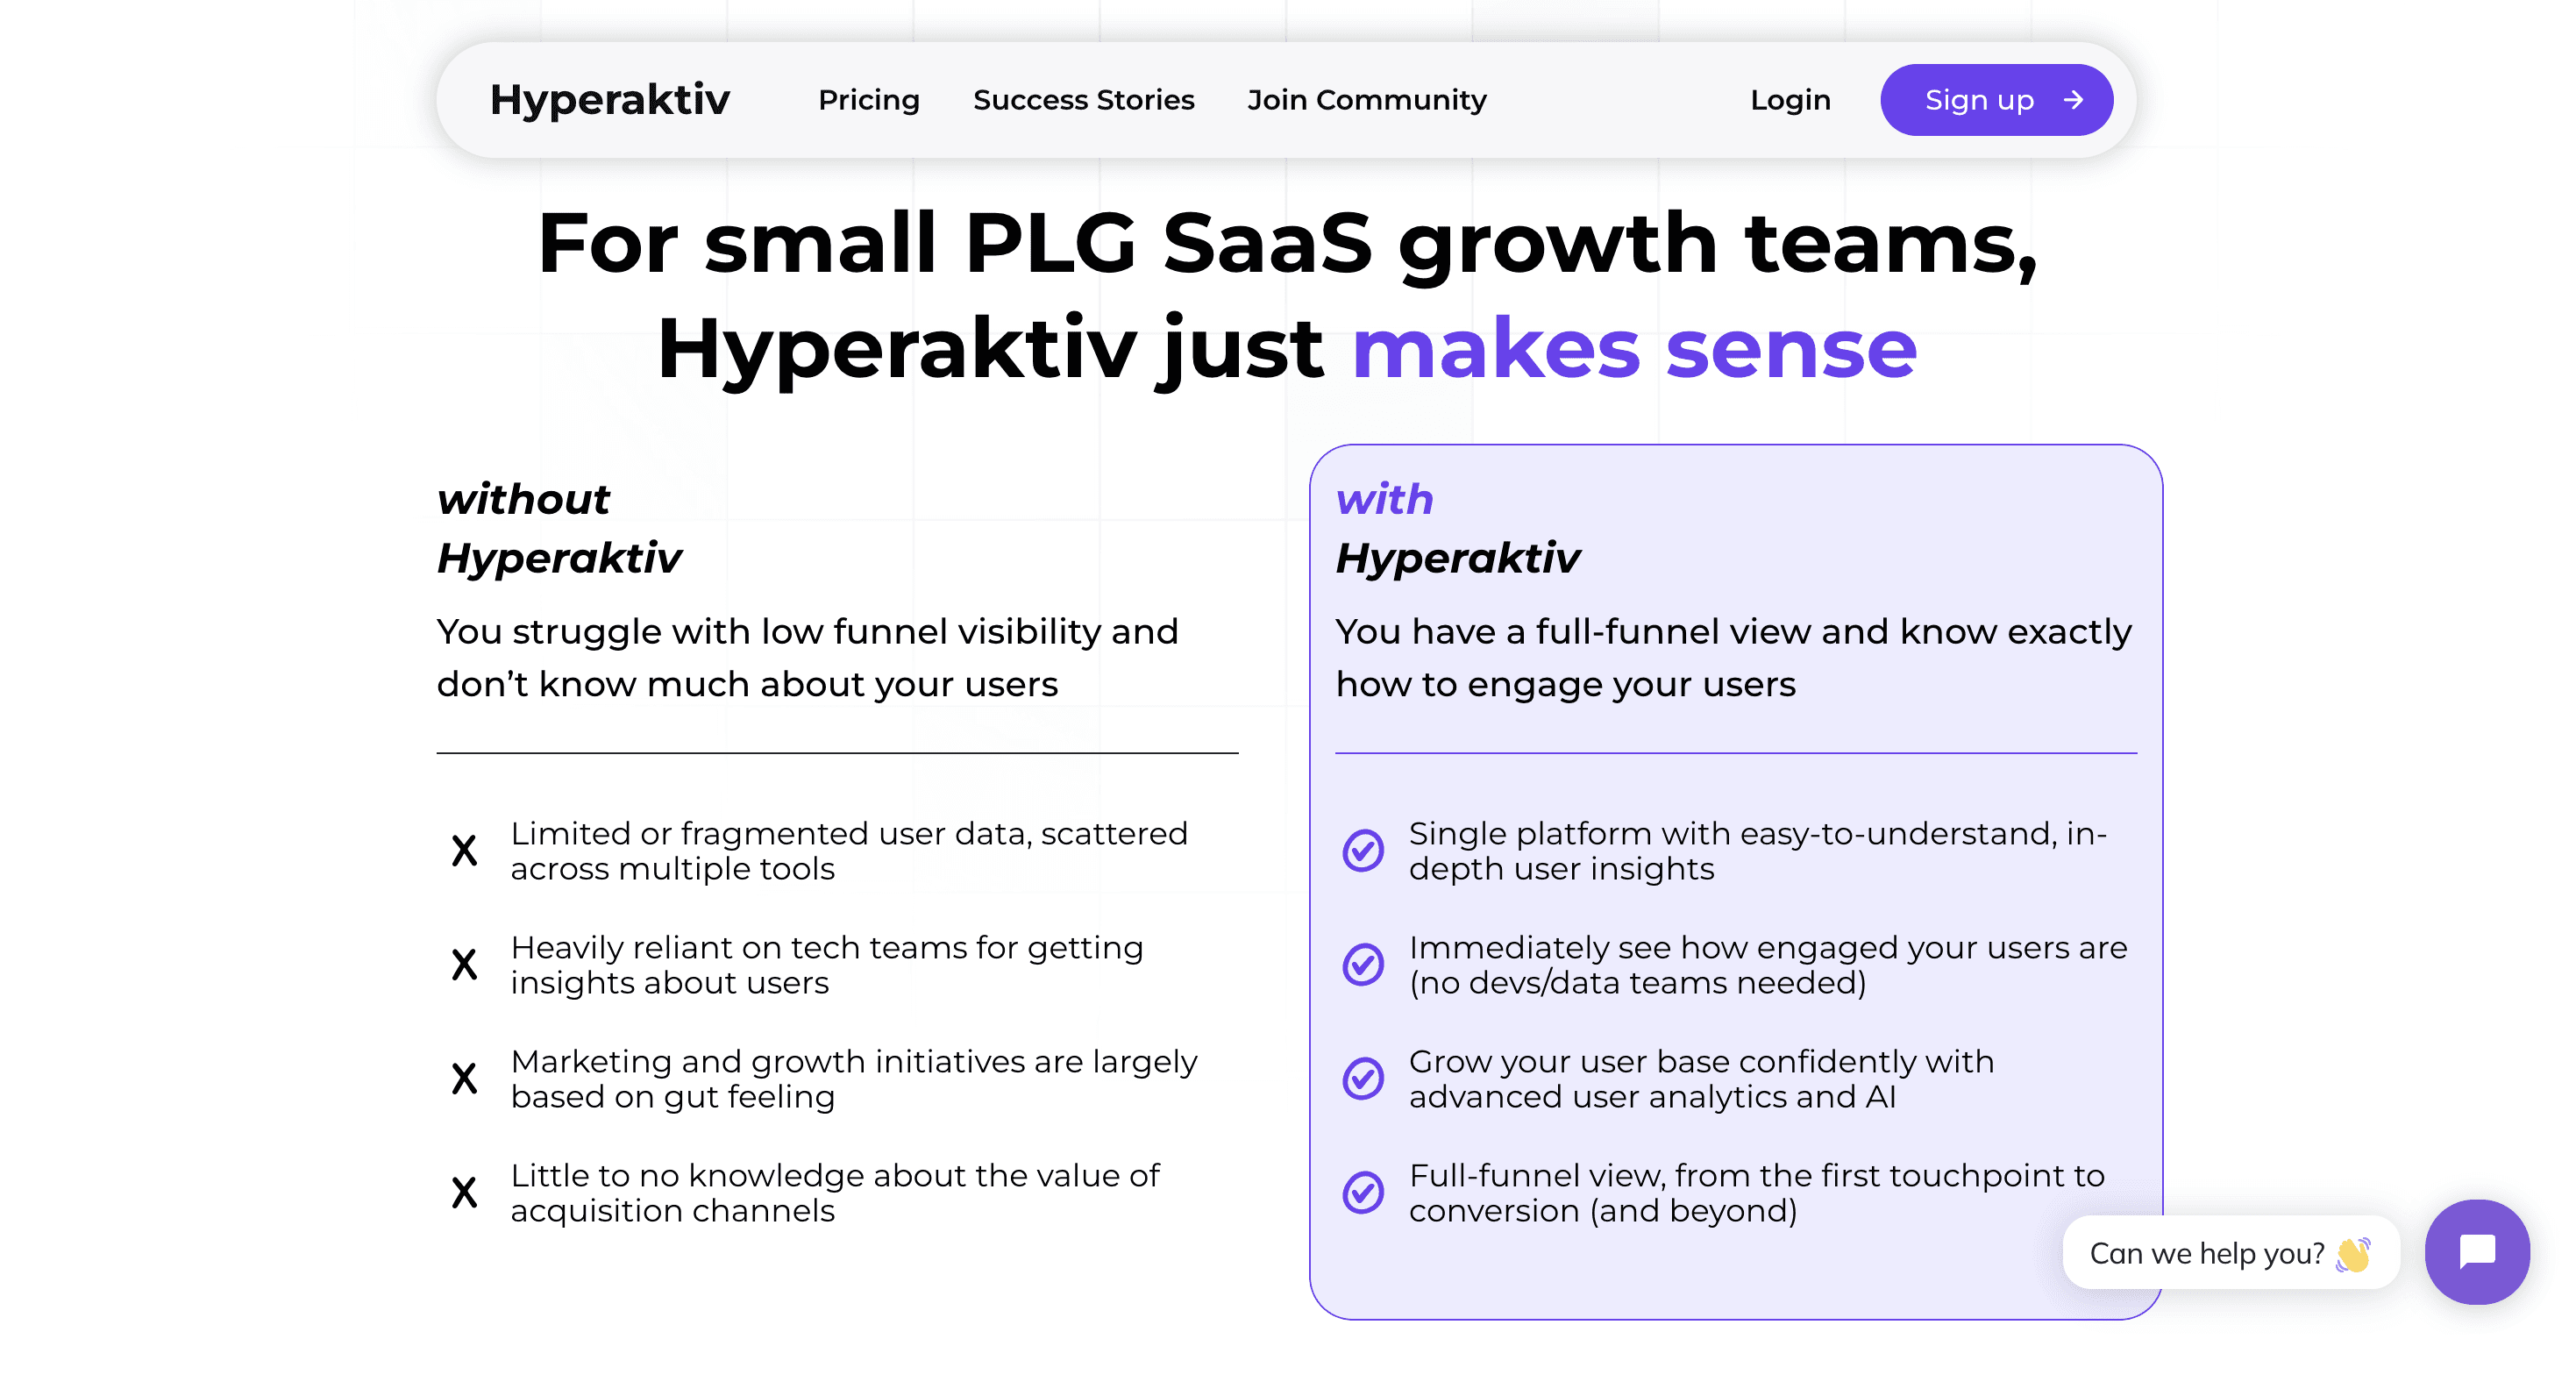
Hyperaktiv is a user segmentation software providing high level insights and recommendations to increase acquisition, retention and conversion. Detailed user-related information collected by the tracking infrastructure is combined with enrichment datasource on the internet and AI to identify the users with the best profile for your B2B SaaS business.
Main advantages:
Easy and quick setup.
Covers the whole user life-cycle: acquisition, activation, retention and conversion.
Main disadvantages:
Not possible to create your own charts.
Complementary to Amplitude / Mixpanel / Posthog.
Core features:
AI + enrichment: based on the email of your user, Hyperaktiv can basically determine any datapoint related to them or their company in order to qualify how much they match your ICP: industry, role, size of the company, or any other datapoint that can be determined by online data.
Engagement scoring based on life-cycle segmentation: the most engaged users are identified as Champions at each stage of the life cycle: website visitors, signups, activated users, trial users, paid customers.
Typical user: Growth, marketing, revops
Pricing:
Free up to 1K monthly active users.
50€/month up to 5K monthly active users.
Pay as you go.
Conclusion
Most of the time, companies are using a set of 2 to 4 software tools, all plugged as destinations of the same event-tracking infrastructure. Having only 1 tracking infrastructure guarantees that the metrics from one software to another match, and it simplifies the technical setup.
There is no standard configuration that would fit all companies on the market, but a lot of B2B SaaS companies are implementing the following tools with great success:
Google Tag Manager: to collect events and notify all tracking software.
Posthog: so software developers can debug anything.
Google Analytics: so marketers can get a quick overview of the traffic on the website.
Hotjar: so UX/UI designers can improve the website and the product.
Hyperaktiv: so growth hackers, growth marketers and sales can constantly improve the efficiency of the funnel.